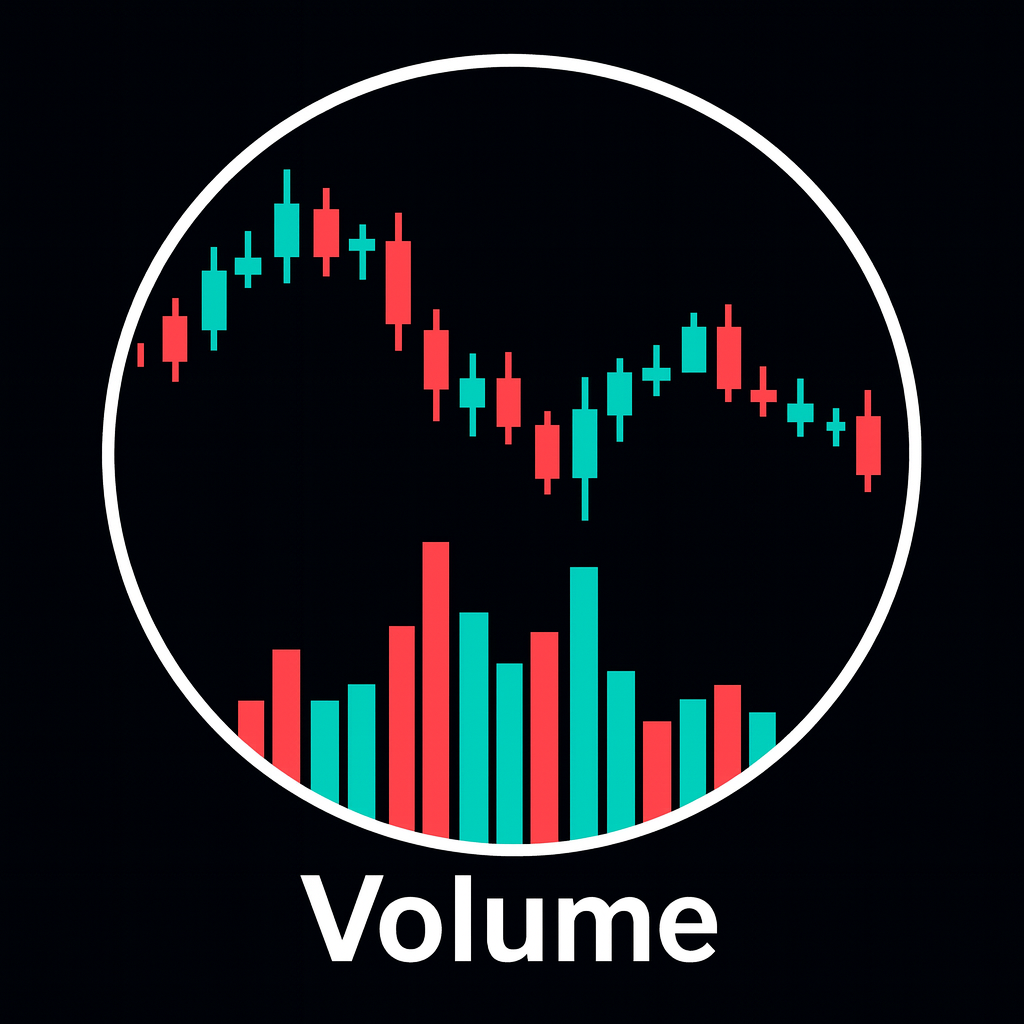
Price shows you where the market moved. Volume tells you who showed up to make that move happen. Volume indicators sit underneath price and answer a simple but critical question: was this move driven by strong participation, or did it drift on thin liquidity and weak interest? For traders who want to understand the crowd behind every candle, Volume indicators are not optional add-ons, they are core context.
What volume actually measures
At the most basic level, volume counts how many contracts, shares or lots changed hands during a specific period. Each bar on a volume histogram aggregates all trades that occurred inside that candle. A tall bar means heavy activity; a short bar means quiet trading. This is true whether you are looking at a one-minute chart or a monthly chart.
However, the message of volume is not absolute. A 10,000-contract bar may be enormous on a quiet instrument and tiny on a major index future. What matters is relative volume: how today compares to the instrument’s typical activity. That’s why many traders mentally benchmark current volume against the average of the last 20–50 bars or use indicators that normalise volume for them.
Core volume indicators you will meet
There are many tools built on top of raw volume. Some of the most widely used in modern trading platforms are
1. Raw volume histogram
This is the classic coloured bar chart under your candles. Each bar represents the total trades in that period. Key ideas
- Rising volume with trend: price pushes in one direction while volume expands. This often confirms a healthy move.
- Falling volume with trend: price continues, but volume dries up. This hints at trend fatigue.
- Volume spikes: sudden, extreme bars mark climactic events such as news, forced liquidations or large institutional decisions.
2. VWAP (Volume Weighted Average Price)
The volume weighted average price (VWAP) is the average price paid across the session, weighted by how much volume traded at each level. It resets at the start of each new session. Institutions often benchmark their execution quality against VWAP, so it tends to behave like a moving value magnet throughout the day.
Typical uses include
- Treating VWAP as a fair value line. Sustained trading above VWAP suggests buyers have the upper hand; below it, sellers dominate.
- Using VWAP bands (VWAP ± standard deviations) to frame intraday extremes where mean reversion trades may appear.
- Watching how price reacts when returning to VWAP after a strong impulse away from it.
3. Volume profile
Volume profile rotates volume information horizontally. Instead of volume bars under time, you get horizontal histograms along the price axis, showing how much trading occurred at each price level over a chosen lookback window.
This unlocks several useful concepts
- High-volume nodes (HVNs): price levels that attracted heavy trade. They often act as balance areas where price slows or oscillates.
- Low-volume nodes (LVNs): price levels that the market rushed through with little interest. When revisited, these zones are often crossed quickly again.
- Point of control (POC): the single price level with the most volume, frequently behaving as a magnet and pivot.
4. OBV and money-flow style indicators
On Balance Volume (OBV) and money-flow indicators (like Chaikin Money Flow or the Money Flow Index) combine price and volume into a single line. They track whether volume flows with up-closes or down-closes over time, creating a smoothed view of accumulation or distribution.
These tools are particularly interesting when they diverge from price, hinting that smart money may be acting against the visible trend.
How to read volume with trends and ranges
The main value of Volume indicators lies in how they interact with structure. A few high-probability patterns show up repeatedly across markets and time frames.
1. Trend confirmation and exhaustion
In a healthy uptrend, you often see
- Expanding volume during impulsive bullish candles.
- Softer volume during pullbacks and consolidations.
As a trend matures, the character changes
- Price continues to make higher highs, but each new push prints lower or flat volume.
- A final breakout occurs on exceptionally high volume followed by quick rejection. This looks like a blow-off top.
The mirror image pattern occurs in downtrends, where selling climaxes can mark strong but risky reversal spots.
2. Volume in consolidation zones
Inside a range or triangle, volume usually contracts. The market is undecided; both sides probe but nobody commits heavily. This shrinking participation forms a coiled spring. A quality breakout often shows
- Compression and thinning volume inside the pattern.
- A decisive breakout candle with clearly rising volume.
- healthy volume on follow-through bars.
Breakouts that occur on weak or average volume are more likely to fail or revert.
Volume at support, resistance and key levels
Support and resistance zones are not just lines; they are memory of previous heavy trade. Volume indicators refine how you read those areas.
- Rejection with spike: price tags a key level and gets violently rejected on very high volume. This often marks an aggressive defence by big players.
- Acceptance with build-up: price sits and trades repeatedly at a level with strong but steady volume. The market is digesting that price as fair value.
- Slice-through on low volume: price drifts through a supposed level without much volume. That level was not meaningful to current participants.
When a volume profile shows an HVN exactly at a prior swing high or low, that level becomes especially important: many positions were opened there, and traders will defend or exit at that price in the future.
Volume divergences and what they signal
A divergence is a disagreement between price and a Volume indicator. Common examples include
- Price makes a new high, but raw volume prints a lower peak than on the previous high.
- Price pushes to new lows while OBV or money-flow indicators fail to make new lows.
Such patterns do not guarantee reversals, but they warn that the current trend is running on fewer new participants. In practice, you combine volume divergence with other tools: support and resistance, candlestick patterns, and higher-time-frame bias. Volume says, “momentum is suspect”; price action tells you when traders actually flip.
Intraday vs higher-time-frame volume
On intraday charts, volume is heavily shaped by session rhythms: open auctions, lunch lulls, and closing imbalances. It is normal to see huge bars at the open and close compared to the middle of the session. Interpreting Volume indicators intraday requires acknowledging this pattern and looking at relative volume inside each intraday segment, not just across the entire day.
On higher time frames (daily, weekly, monthly), structural stories stand out more clearly: quiet accumulation phases, news-driven spikes, and long periods where an instrument falls out of favour. A single weekly volume spike is often more meaningful than a dozen minor intraday flurries.
Comparing key volume tools
| Tool | Main question answered | Best use case |
|---|---|---|
| Raw volume histogram | How active is this bar compared to recent bars? | Confirming breakouts, spotting climaxes and dry-ups. |
| VWAP | At what average price did the session’s volume trade? | Intraday bias, institutional benchmark, mean-reversion zones. |
| Volume profile | Where has the market spent the most and least time trading? | Finding balance areas, magnets, and fast-move price gaps. |
| OBV / money-flow | Is volume flowing more into up-moves or down-moves? | Spotting hidden accumulation or distribution and divergences. |
Common mistakes when using Volume indicators
Traders frequently misuse volume in a few predictable ways
- Treating any spike as bullish or bearish by itself. A spike simply means big interest; the candle structure and context determine who won.
- Ignoring instrument specifics. Some markets naturally have irregular volume patterns. Always learn the normal rhythm of what you trade.
- Over-fitting exotic indicators. It is tempting to stack several Volume indicators and look for perfect alignment. In reality, two or three simple tools used consistently are more effective.
Volume is a supporting actor. It rarely should be your only trigger. Instead, Volume indicators should validate or challenge trade ideas built on structure, trend and risk management.
Building a simple volume-aware workflow
You do not need complex algorithms to benefit from Volume indicators. A practical, repeatable workflow might look like this
- Define the higher-time-frame trend and key support and resistance zones.
- Mark major high-volume nodes and the current session VWAP.
- Wait for price to approach an important level or break from a consolidation pattern.
- Check whether volume expands in the direction of the move or stays muted.
- Look for confirming or contradicting signals from OBV or money-flow indicators.
- Use this information to refine entry timing, stop placement and expectations for follow-through.
Conclusion
Volume indicators shift your perspective from “What did price do?” to “Who was actually involved when it did it?”. Raw volume, VWAP, volume profile and money-flow tools all tell different parts of the same story: where the crowd committed capital, where it hesitated, and where it may be trapped. Combined with clean structure and disciplined risk management, Volume indicators help you separate meaningful moves from noisy drift and keep your trading aligned with real participation instead of illusion.