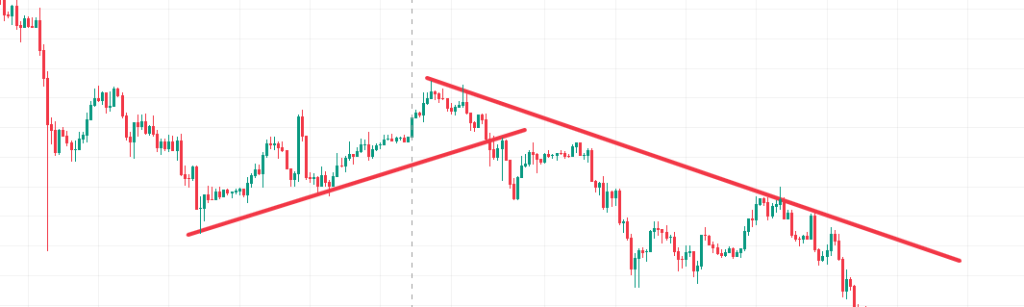
Trend lines in trading are one of the simplest tools on a chart, yet they are also among the most abused. Drawn well, they give a clean visual of market structure, help you define trend direction, time entries and exits, and frame risk. Drawn badly, they become random lines that justify any bias you already have. This guide walks through exactly how to draw and use trend lines correctly, where they fail, and how to integrate them into a complete trading plan.
What is a trend line?
A trend line is a straight diagonal line drawn on a price chart to connect a series of swing points. In an uptrend, you connect higher swing lows to show where buyers repeatedly defend price. In a downtrend, you connect lower swing highs to show where sellers repeatedly step in.
The key idea is that a trend line is a graphical shortcut for underlying structure: it represents the area where supply or demand has been strong enough to turn price in the past. The more frequently price reacts near the same diagonal area, the more confidence you can place in that line as a dynamic guide.
Core rules for drawing trend lines
To make trend lines in trading actually useful, you need a consistent rule set. The market is messy; your rules must be cleaner than the noise you are trying to filter.
1. Start with a clear trend
Do not draw a trend line in a sideways market and then declare that a trend exists. First decide if price is broadly making higher highs and higher lows (uptrend) or lower highs and lower lows (downtrend). Only then reach for the line tool.
2. Use obvious swing points, not tiny fluctuations
A valid trend line must be anchored at clear swing highs or swing lows that are visible without zooming in excessively. If you have to squint or zoom to 200% to justify a connection, the line is probably not meaningful.
- In an uptrend, connect the first obvious swing low with the next higher swing low.
- In a downtrend, connect the first clear swing high with the next lower swing high.
Very minor intrabar wiggles and noise should not be used as anchors.
3. Require at least two touches, then look for a third
The first time you connect two swing points, you are only defining a potential trend line. The third touch is the first real test. A strong line usually has
- Two anchor points to define the line.
- One or more additional touches where price reacts near the line and respects it.
If price cuts straight through the line on the next approach with no hesitation, the market is telling you that the line has little relevance.
4. Respect the timeframe
A trend line drawn on a weekly or daily chart is more important than one drawn on a five-minute chart. Higher-timeframe participants control more capital and their levels matter more. When in doubt, draw from the top down
- Mark major trend lines on the weekly and daily chart.
- Then refine with additional intraday lines on the four-hour, one-hour or lower charts.
This prevents you from trading aggressively into a major higher-timeframe line that you simply forgot to check.
5. Keep the line as straight as possible
Trend lines are straight by definition. Do not bend or curve them to “hug” price. If new price action makes your existing line no longer fit, you have two options
- Keep the original line and accept that the trend is weakening or broken.
- Delete and redraw using fresh swing points, treating the old line as invalid.
Editing a line repeatedly to fit each new swing is just curve fitting.
6. Do not cut through major candles
A clean trend line should sit under most candle bodies in an uptrend (or above them in a downtrend). It is fine if some wicks pierce the line; that is normal volatility. What you want to avoid is a line that cuts through big, obvious candle bodies just to connect two distant points. That kind of line is cosmetic, not structural.
When not to trust a trend line
Trend lines are not mystical; they are simply a visual proxy for market behaviour. There are clear situations where you should reduce your trust in them.
Choppy, overlapping price action
If candles overlap heavily, with long wicks and frequent direction changes, the market is ranging or undecided. In this environment, any diagonal line you draw is likely to be arbitrary. Horizontal support and resistance usually offer more insight in such conditions.
Very steep lines
Extremely steep trend lines that almost look vertical are often unsustainable. They reflect an emotional move, not a stable trend. Price tends to break such lines quickly or shift into a more moderate angle after a blow-off move. Treat steep lines as short-term guides, not long-term structure.
Too few touches
A line with only one anchor point and a speculative second point is not reliable. The first “touch” after drawing such a line is really just price arriving at your guess. Wait until you have at least three meaningful reactions before using the line as a serious decision tool.
Building channels from trend lines
Once you have a solid trend line, you can often clone it to create a channel. In an uptrend, you might
- Draw the main trend line under price, connecting higher lows.
- Copy and drag the same line to connect one or more swing highs.
The space between the two lines becomes a channel that visually frames the trend. Price oscillating from the lower boundary to the upper boundary offers natural swing targets, and a clean break out of the channel can signal trend acceleration or exhaustion.
The same logic applies in a downtrend, just flipped: the main trend line is above price, and the channel copy is drawn through lower lows.
Multi-timeframe trend line confluence
Trend lines in trading become truly powerful when combined across timeframes. A typical workflow might look like this
- On the daily chart, draw the primary trend line that defines the major uptrend or downtrend.
- Drop to the four-hour chart and mark shorter-term lines that operate inside the larger structure.
- Use the one-hour or lower charts for precise entries when price reacts at the intersection of multiple lines.
Where a lower-timeframe trend line aligns with a higher-timeframe line, a horizontal support or resistance zone, and perhaps a moving average, you have a cluster of reasons for other traders to pay attention. That cluster is where reactions are most likely.
Checklist: strong vs weak trend lines
The table below summarises the difference between strong and weak lines
| Strong trend line | Weak trend line |
|---|---|
| Drawn on a clear uptrend or downtrend | Drawn in a sideways, overlapping range |
| Anchored at obvious swing highs or lows | Anchored at minor noise or tiny fluctuations |
| Has at least three clean touches or reactions | Only connects two distant points with no tests |
| Respects most candle bodies, pierced mainly by wicks | Cuts through major candle bodies to force a fit |
| Visible and relevant on higher timeframes | Only visible on very low timeframes |
Practical trading applications
Trend lines in trading are not a complete system by themselves, but they are an excellent framework for structuring decisions.
- Buying pullbacks in an uptrend: When price pulls back towards a rising trend line and stalls with bullish candles, you have a logical area to look for long setups. Stops can be placed just beyond the line or beyond the last swing low.
- Selling rallies in a downtrend: In a falling market, look for price to rally towards a descending trend line and show rejection. Bearish candles, long upper wicks or momentum loss at the line can all support a short.
- Spotting early signs of reversal: A clean break and retest of a well-respected line often marks a change in behaviour. For example, if a long-held rising trend line finally breaks and price retests it from below, failing to get back above, that can be an early warning of trend exhaustion.
- Managing trades: As long as price respects your line, you can justify staying in the trade. When price closes decisively through it with momentum, you have a structural reason to scale out or exit.
In every case, combine trend lines with other tools: horizontal support and resistance, volume, price action patterns, and higher-timeframe context. The line gives structure; the confluence gives probability.
Conclusion
Used with discipline, trend lines in trading turn messy charts into readable maps. Define the trend first, anchor your lines at clear swing points, demand multiple touches, and treat higher-timeframe lines with more respect. Avoid forcing lines to fit your bias and be quick to admit when a line has broken and lost its value. When you layer clean trend lines with horizontal levels and price action, you gain a robust structural framework that can support almost any trading style, from swing trading to intraday scalping.