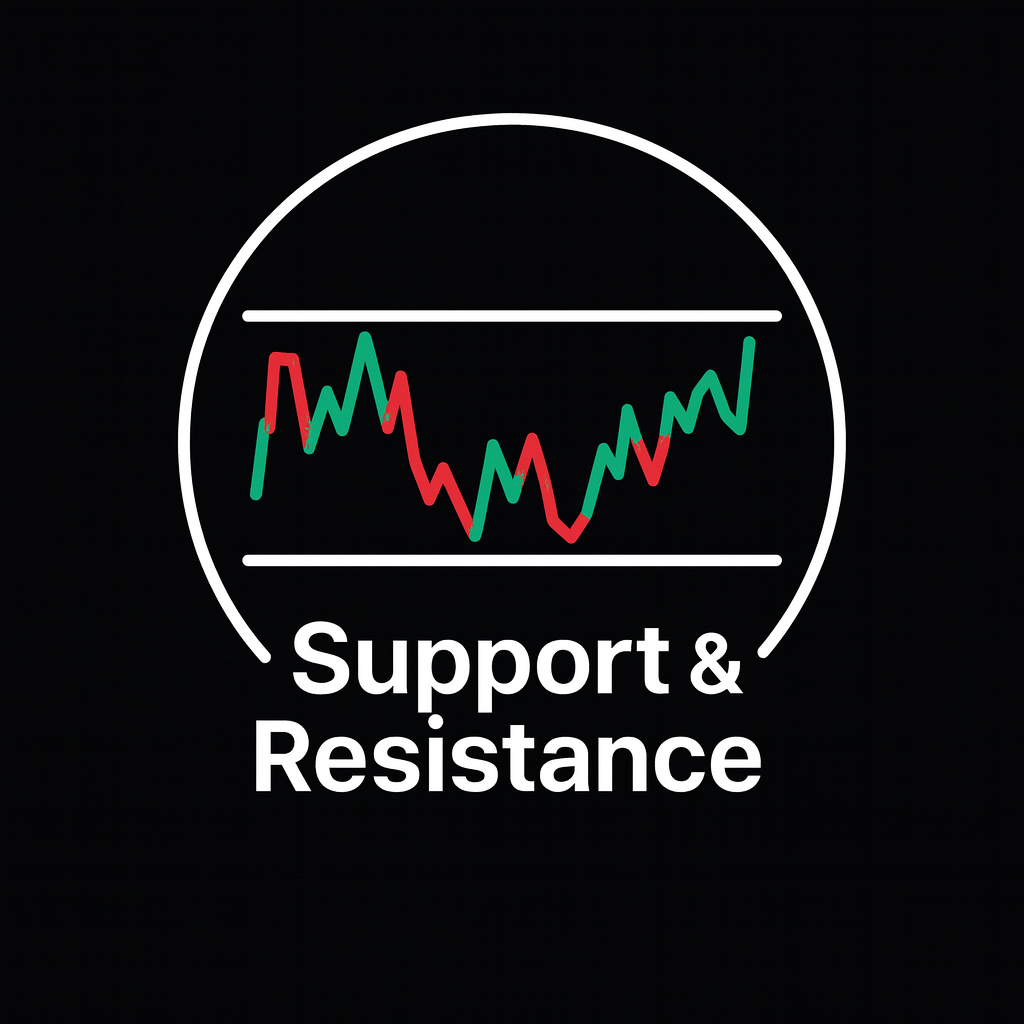
Support and resistance are the most basic tools on a price chart, yet they quietly sit behind almost every trading decision. Whether you trade forex, indices, crypto, or stocks, you are always buying near support and selling near resistance, or the other way around. Understanding how these zones form, how to draw them, and how to use them for entries, exits, and risk control is a core trading skill.
What are support and resistance?
A support zone is an area on the chart where falling prices have repeatedly stalled or reversed in the past. It represents a region where buyers were willing to step in aggressively enough to stop the decline. A resistance zone is the opposite: an area where rising prices have repeatedly stalled or reversed, signalling that sellers were willing to take profits or open fresh shorts.
Think of support and resistance not as single magic lines but as price regions. In liquid markets, order flow is spread over a band of prices, not a single tick. When you mark levels as narrow zones rather than razor-thin lines, you will tolerate small overshoots and avoid being tricked by minor spikes through the level.
How to draw horizontal support and resistance
Horizontal support and resistance come from three main sources: repeated swing highs and lows, consolidation shelves, and high-activity areas on volume-based tools. The goal is to identify prices that clearly mattered to many traders before and are therefore likely to matter again.
Using swing highs and swing lows
Start with a clean chart and zoom out. Mark areas where price has turned several times at similar levels. Two touches can be interesting; three or more clean reactions form a strong level. For support, look for repeated lows followed by rallies. For resistance, look for repeated highs followed by declines. The more tests a level has survived, and the more time between those tests, the more meaningful it tends to be.
Consolidation shelves and bases
Next, look for sideways ranges that formed before strong moves. A tight consolidation range before a powerful breakout often becomes an important support or resistance area later when price revisits it from the other side. These zones show where large players quietly accumulated or distributed positions before revealing their hand with a big move.
High-volume nodes and liquidity pools
If you use volume profile or similar tools, pay attention to price areas where a lot of trading occurred. These zones often act as magnets in the future because many participants have open positions there and care about that price level. When price returns, some traders defend the area, others exit or add, and support and resistance behaviour emerges again.
Multi-timeframe context for support and resistance
Not all levels are equal. A support and resistance zone drawn from the weekly chart carries more weight than one drawn from the five-minute chart. A practical workflow is to start on a higher timeframe to map the big picture and then drill down.
On the weekly and daily charts, mark the most obvious turning points and major consolidation ranges. These are your macro levels. Then move to the four-hour or one-hour chart and refine local zones inside the higher-timeframe structure. Intraday traders might finally drop to the fifteen-minute or five-minute chart only for fine-tuning entries, never forgetting where the higher-timeframe levels sit.
This top-down approach prevents you from obsessing over tiny intraday levels that sit directly inside a much larger weekly resistance, where the bigger players are taking profits or adding to positions against you.
Trading strategies using support and resistance
Once your chart is marked, support and resistance can guide both trend-following and mean-reversion approaches. The key is to decide in advance: are you trading with the trend away from a level, or fading price into a level expecting a bounce?
Trend pullbacks into support
In an uptrend, the simplest strategy is to wait for price to pull back into a previously confirmed support zone. You want to see the market respecting higher highs and higher lows, then dipping back into support with weakening bearish candles. Confirmation can come from a bullish candlestick pattern, a rejection wick, or momentum indicators turning back up. Stops usually go just beyond the support zone, while targets aim for previous highs or the next resistance band.
Selling rallies into resistance in a downtrend
In a downtrend, you simply flip the logic. Identify clear resistance areas above current price where previous rallies failed. Wait for price to climb back into that zone with shrinking bullish candles or signs of exhaustion, then look for a bearish pattern to enter short. Stops are often placed just above the resistance zone, and targets are set at previous lows or the next major support.
Range trading between support and resistance
Sometimes markets are not trending; they are rotating between a ceiling and a floor. In a well-defined range, buying near support and selling near resistance can be effective. However, you must accept that ranges eventually break. Many range traders will reduce position size, take profits earlier, and be quick to exit when price closes strongly beyond the level, signalling a possible breakout.
Breakouts, retests, and failed breaks
Support and resistance also structure breakout strategies. When price finally breaks through a well-respected level with a strong candle and increased activity, traders may enter on the break itself or wait for a retest. A classic pattern is the breakout, retest of the old level from the other side, and continuation. Failed breaks are equally powerful signals: when price spikes above resistance but quickly falls back below, or dips under support and snaps back, it often traps traders in the wrong direction and fuels a move the other way.
Stops, targets, and position sizing
Support and resistance provide logical anchors for risk management. The invalidation point for a trade is usually just beyond the level you are trading from. If you buy at support and price closes decisively below that zone, the idea is wrong and the trade belongs in the bin. Likewise, if you short at resistance and price closes cleanly above it, you close the trade and reassess.
Targets should also respect the map. Conservative traders may aim for the midpoint of the range between support and resistance, while more aggressive traders hold for the next major level. Once you know the distance from entry to stop and from entry to target, you can calculate reward-to-risk and adjust position size so that any single loss remains small relative to your account.
Common mistakes with support and resistance
Many newer traders misuse support and resistance in predictable ways. One common mistake is drawing far too many levels, cluttering the chart until nothing is clear. Another is curve-fitting: forcing lines to match every swing high and low instead of highlighting only the most important zones.
Traders also get into trouble when they treat levels as unbreakable walls. No support and resistance zone holds forever. Markets evolve, liquidity shifts, and old levels eventually fail. Professional traders respect levels but never worship them; they combine them with trend analysis, volatility, and clear invalidation rules.
A final mistake is neglecting to update the map. As new swings and consolidations form, some old levels lose relevance while new ones become important. Periodically cleaning your chart keeps your view aligned with current market structure.
Practical checklist for using support and resistance
- Start on higher timeframes to mark major zones, then refine on lower timeframes.
- Treat support and resistance as zones, not single-price lines.
- Look for multiple touches and clear reactions to validate a level.
- Use price action, candlestick patterns, or indicators as confirmation rather than trading blind at every level.
- Place stops beyond the level and size positions so losses stay manageable.
- Regularly review and simplify your levels to reflect the current structure.
Conclusion
Support and resistance will not predict the future, but they will give structure to every decision you make. By learning to draw clean levels, reading how price behaves around them, and anchoring your entries, stops, and targets to those zones, you turn a chaotic chart into an organised trading plan. Used with discipline, support and resistance become a simple but powerful framework that works across markets, timeframes, and strategies.