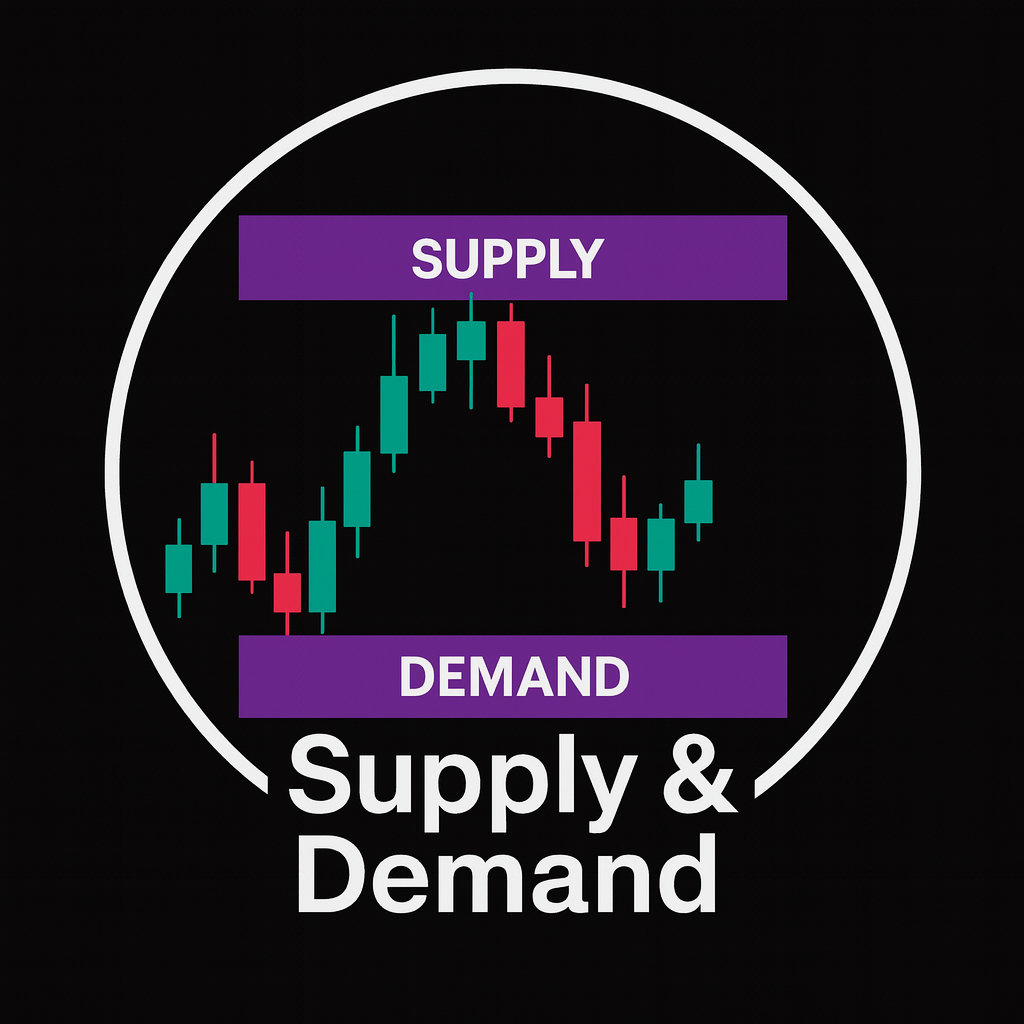
In modern trading chat, you hear people talk about supply and demand order blocks as if they were some newly discovered secret of the markets. They are not. The core idea is almost as old as organized markets themselves: price reacts where big orders are sitting. What changed is mostly the marketing, the labels, and the packaging – not the underlying mechanics.
This article strips away the hype. We will look at what supply and demand zones really are, why they have always been the center of serious technical trading, how the “order block” label appeared, and how to use these concepts in a practical, professional way without turning them into a religion or a personality cult.
Nothing New Under the Sun: The Long History of Supply and Demand
Decades before anyone uttered the phrase “order block”, traders were already mapping the footprints of large buying and selling. Classic concepts such as support and resistance, accumulation and distribution, and congestion zones all describe the same phenomenon
- There are price areas where demand has repeatedly stepped in and stopped declines.
- There are price areas where supply has repeatedly appeared and capped rallies.
Old-school tape readers, pit traders, and the early technical analysts all used variations of these ideas. They talked about “strong hands”, “composite operators”, “professional money”, or “big players”, but the logic was identical: when the market leaves a clear footprint of aggressive buying or selling, that footprint can matter again when price returns.
So when we talk about supply and demand zones today, we are not talking about a private, proprietary discovery. We are talking about a structured way to label something traders have observed for over a century.
What Are Supply and Demand Zones, Really?
On a chart, a demand zone is a base from which price launches into a strong rally. A supply zone is a base from which price collapses in a sharp sell-off. The logic is simple
- Before the move, price consolidates in a relatively tight area. That base is where large orders are being filled.
- Once those orders are mostly completed, price explodes away. The impulse move is the “footprint” of aggressive participation.
To mark these zones, traders usually
- Find a strong impulsive move (fast, directional candles with little overlap).
- Look immediately left for the last small consolidation or pause before that impulse.
- Draw a rectangle that covers the real bodies and wicks of that base.
That rectangle is your demand or supply zone. Later, when price returns, you are watching to see whether remaining unfilled orders, or new aligned orders, reactivate the area.
Where Did the Name “Order Block” Come From?
The phrase “order block” is basically a rebranding. In the 2000s and 2010s, as retail trading education exploded online, some educators wrapped the classic idea of institutional footprints in new terminology. Instead of “support”, “resistance”, or “base”, they began saying “this candle cluster is an order block” – meaning a block of institutional orders that moved the market.
That label stuck because it sounds concrete and institutional. But the underlying logic is the same old story: a block of aggressive buy or sell orders left a visible footprint on the chart. Calling it an “order block” did not magically create a new edge. It simply gave a name to a structure traders had studied for generations.
So when you hear about supply and demand order blocks, understand that you are not being initiated into a new secret. You are being shown a modern wrapper for a very old concept.
Knowledge Does Not Belong to a Clique
In the forex world, it is common to see claims like “this method belongs to our inner group” or “only our students really understand these order blocks”. That story sells courses, but it does not fit reality.
Markets are public. Price data is public. The logical interpretation of that data cannot be owned by a clan, a brand, or a channel. The same structures appear for every trader, on every chart, regardless of who explained them to you.
What separates traders is not access to secret shapes but
- How consistently they apply a clear framework.
- How well they manage risk, leverage, and position size.
- How disciplined they are in execution and review.
There is no holy figure sitting above the market. There are only traders who are more or less consistent in following a robust plan. Elevating educators into untouchable heroes, and treating their version of order blocks as sacred, is a fast route to disappointment. Respect ideas, test them, adapt them. Do not worship the messenger.
How to Mark Supply and Demand Order Blocks Step by Step
If you want a clean, testable process, you can structure it like this
1. Start from the Higher Time Frame
Begin on a higher time frame such as H4, daily, or weekly. Identify where the major swings started with obvious strength
- Long-bodied candles with minimal wicks that travel far.
- Breaks of important previous highs or lows.
- Clear displacement – price does not just drift, it accelerates.
These are your anchor legs. The bases that launched these legs are potential higher time frame order blocks.
2. Locate the Base
Immediately before each strong leg, find the final small consolidation, pause, or tight cluster of candles. This is what many traders label the “block”. For a demand zone, it is the last downside or sideways structure before the sharp rally. For a supply zone, it is the last upside or sideways structure before the aggressive drop.
Draw your rectangle from the extreme wick to the opposite side of the base, or use a more conservative approach that covers the candle bodies only. The choice should be consistent so you can actually test it.
3. Refine on a Lower Time Frame
Once the higher time frame block is in place, drop down to a lower time frame (H1, M15, M5). You can often refine the zone to a more precise range, or see internal structures such as mini consolidations, smaller impulse moves, and minor breaks of structure.
This multi-time-frame approach keeps you aligned with the big flows while allowing precise entries and tight stops. It also helps you avoid drawing a rectangle so huge that it becomes useless in real trading.
4. Wait for Confirmation on Return
When price revisits your zone, do not assume it will reverse just because your box is on the chart. Confirmation might include
- Rejection wicks that spike into the zone and close back out.
- Engulfing candles in the new direction.
- A clear change of character (CHoCH) on a lower time frame, where local highs or lows are decisively broken.
- Volume or momentum shifts that support the idea of fresh participation.
Only after that confirmation do you consider entering. The edges of the zone give you a structured place for stops and targets.
Common Mistakes with Order Blocks
The concept is powerful, but many retail traders misuse it in predictable ways
Drawing Blocks Everywhere
When every minor wiggle becomes a supply or demand area, the chart turns into a collection of random boxes. A useful rule is: if the move away from the base was not clearly impulsive, it is probably not worth treating the base as a priority zone.
Ignoring Trend and Context
A lonely demand zone inside a strong weekly downtrend is not the same as a demand zone aligned with weekly and daily bullish structure. Supply and demand order blocks are context-dependent. Higher time frame trend, volatility, and macro conditions all increase or decrease their weight.
Trading Without Risk Framework
Perfectly drawn blocks do not protect you from over-leverage. Stop-loss placement, position sizing, and a pre-defined maximum loss per day or week matter more than how precise your rectangle is. Many traders lose money with good analysis because their risk rules are weak or nonexistent.
Hindsight Worship
On screenshots, every box looks magical. In real time, uncertainty is the rule. Always distinguish between what you could see before the move and what you are admiring after the fact. Only the former can be traded. The latter is marketing material.
Combining Order Blocks with Other Tools
On their own, zones are just areas of interest. Their power increases when you combine them intelligently with other elements
- Structure: trend direction, higher highs and higher lows, or lower highs and lower lows.
- Liquidity: equal highs, equal lows, stops above and below clear swings that can be swept into the zone.
- Volatility measures: average daily range, session ranges, or volatility bands to avoid chasing extremes.
- Time of day: session opens, key economic releases, and closes, which often align with strong moves from or into zones.
The point is not to complicate the chart but to stack logic. When several independent reasons point to the same area, the setup quality improves.
Reality Check: What Actually Makes a Trader “Good”
A trader is not superior because they use a particular vocabulary. They are judged by consistency over a large sample of trades. The ones who last usually
- Use a small set of concepts like order blocks, trend, and liquidity, and apply them the same way every day.
- Keep detailed records, review their trades, and refine rules based on evidence, not emotion.
- Ruthlessly control downside risk so that no single idea, zone, or day can destroy the account.
There is no private “school of truth” inside forex. Ideas circulate, evolve, are tested and retested by thousands of traders. The healthy culture is one where knowledge is shared freely, discussed critically, and evaluated by results, not by who said it first.
Conclusion
Supply and demand zones and their modern label, order blocks, sit at the heart of price action because they describe something fundamental: where size actually traded, where imbalances appeared, and where they might reappear. They are not a new invention, not the property of a single educator, and not a magic key to guaranteed profits.
Used well, they give structure to your chart, help you define logical areas of interest, and provide anchor points for risk management and execution. Used poorly, they become just another buzzword and another excuse to avoid doing the real work of testing, journaling, and refining.
Treat supply and demand order blocks as one powerful lens among several, not as a sacred secret. Combine them with sound risk management, multi-time-frame context, and a disciplined process, and you have something robust enough to survive the noise of the market and the noise of the internet.