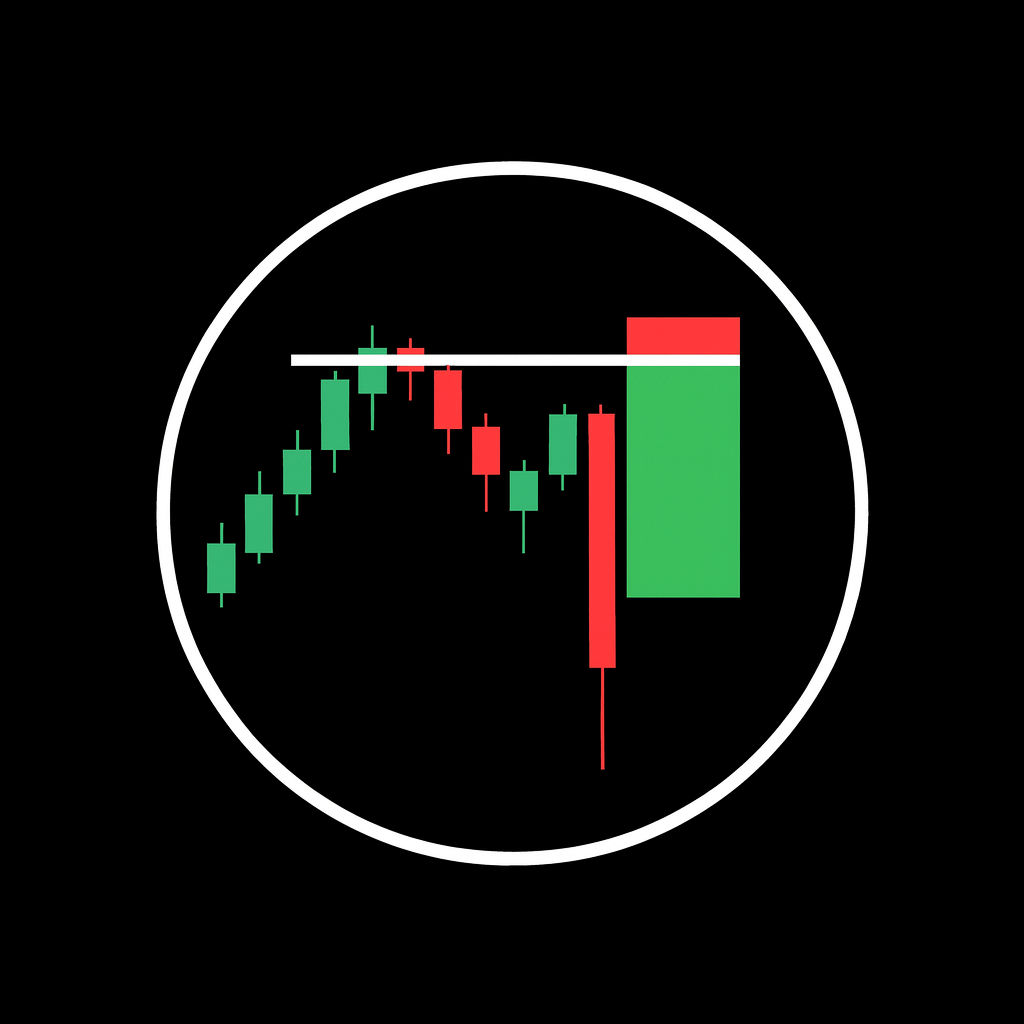
Markets do not trend in one direction forever. Strong moves eventually exhaust themselves, buyers and sellers rebalance, and price starts to turn. Reversal structures are visual footprints of that transition. When understood properly, they help traders avoid buying the top of an uptrend, selling the bottom of a selloff, and position instead for the next leg in the opposite direction.
Reversal patterns form after an extended move, not in the middle of random noise. They show repeated failure to continue in the prior direction, a build-up of trapped traders, and then a decisive break in structure. Used with higher-time-frame context, volume and momentum, these patterns can form the backbone of an objective trade plan.
What are reversal patterns?
Reversal patterns are price formations that signal a potential end to the current trend and the start of a move in the opposite direction. They do not guarantee a reversal. Instead, they indicate that the market is trying to turn and that the prior imbalance between buyers and sellers is weakening.
Typical characteristics include
- An existing clear trend into the pattern (uptrend for bearish reversals, downtrend for bullish reversals).
- Repeated tests of a key area where price struggles to progress (support or resistance).
- Visible loss of momentum: smaller candles, longer wicks, overlapping ranges.
- A decisive break of a key level (neckline, support, resistance, trend line) that changes structure.
High-quality reversal patterns will usually be obvious even to an untrained eye: clear swings, clean levels, and a strong expansion candle that confirms the new direction.
Market psychology behind reversals
The power of these patterns comes from the psychology they represent
- Exhaustion: Trend followers keep buying higher or selling lower, but each new push achieves less distance. Early participants start taking profits.
- Failure: Price revisits a prior extreme but fails to break through decisively. Traders who expected continuation find themselves stuck at poor prices.
- Transition: New orders enter in the opposite direction (counter-trend at first), and gradually overwhelm the remaining trend traders.
- Capitulation: Once a key structural level breaks, trapped traders exit, adding fuel to the new move.
When you trade reversals, you are effectively trading against late trend followers and in favor of those who recognised the turning point earlier.
Key types of reversal patterns
Double tops and double bottoms
A double top appears after an uptrend. Price rallies into a resistance zone, pulls back, then retests the same area and fails again. The line drawn through the pullback low between the two peaks is called the neckline. A break and close below this neckline suggests buyers have lost control and a new bearish leg can begin.
Conversely, a double bottom forms after a downtrend: price tests support, bounces, then retests the area and holds again. The neckline is drawn through the swing high between the two lows. A break above the neckline signals initial bullish control.
Many traders treat the height between the peak (or trough) and the neckline as a rough projection for the minimum target distance once the pattern breaks.
Triple tops and triple bottoms
Triple tops and bottoms are extended versions of the double pattern. Instead of two tests of support or resistance, you see three distinct failures at roughly the same zone. This reflects prolonged battle between buyers and sellers.
The principle is the same: the more times a level holds, the more stops accumulate beyond it. When the neckline finally breaks, the resulting move can be powerful, because both late entries and their protective stops are unwound.
Head and shoulders
The head and shoulders is one of the most well-known bearish reversal patterns. It resembles three peaks
- The left shoulder: a rally into resistance followed by a pullback.
- The head: a higher rally making a new high, then another pullback.
- The right shoulder: a weaker rally that fails to reclaim the head’s high and turns down near the original resistance.
A line connecting the two pullback lows forms the neckline. A clean break and close below this neckline signals that the market has likely transitioned from higher highs and higher lows to a sequence of lower highs and lower lows.
The inverse head and shoulders is the bullish mirror image, appearing after a sustained downtrend.
Cup and handle pattern
A cup and handle is typically a bullish reversal or continuation pattern. After a decline, price gradually forms a rounded bottom (the cup), climbs back to prior resistance, then consolidates in a smaller pullback (the handle) before breaking higher.
The handle usually drifts down or sideways on lower volatility, shaking out weak longs. When price breaks the handle’s resistance with strong momentum, it often marks the start of a sustained advance.
V-shaped and spike reversals
Not all reversals are neat. Sometimes markets reverse violently in V-shaped fashion after a blow-off move or capitulation. These are characterised by
- Large, extended candles in the direction of the old trend.
- A final exhaustion spike with huge range and volume.
- Immediate strong rejection and rapid move in the opposite direction.
V-reversals are harder to trade systematically because they offer less time to build a position. Many traders use them more as a warning to stop trading with the old trend than as primary entry patterns.
Confirming reversal patterns with confluence
A chart formation alone is not enough. The same structure in the wrong context is just noise. High-probability setups combine reversal patterns with additional factors, known as confluence
- Higher-time-frame structure: A double top on a 1-hour chart that aligns with weekly resistance carries more weight than a random pattern in the middle of a range.
- Support and resistance: Patterns forming at well-defined levels where price has turned before are more reliable.
- Volume: Increasing volume on the break of the neckline or key level suggests genuine participation in the new direction.
- Momentum indicators: Tools like RSI or MACD revealing divergence (price making new highs while momentum makes lower highs, or vice versa) can confirm that the prior trend is weakening.
- Volatility: Compression leading into the pattern, followed by expansion on the break, provides a clear before-and-after contrast.
In short, strong reversal patterns rarely appear in isolation. They tend to cluster with other technical evidence that the trend is tired.
Trading reversal setups: entries, stops and targets
There are three common approaches to trading a confirmed reversal
- Breakout entry: Enter as price breaks and closes beyond the neckline or key level. This offers quick confirmation but may come with a wider stop.
- Retest entry: Wait for price to break the level and then retest it from the other side (support becoming resistance or vice versa). This can provide tighter stops and better reward-to-risk, at the cost of missing some moves that never retest.
- Scaled entry: Combine both approaches, entering a partial position on the break and adding on the retest if it occurs.
For stop placement, traders commonly use
- Above the pattern’s high (for bearish reversals) or below its low (for bullish reversals).
- Beyond obvious liquidity zones where stops are likely to cluster, to reduce the chance of being picked off by a quick spike.
Targets are often set using the pattern’s height (distance between neckline and peak/trough), measured and projected from the breakout point. Additional partial profit zones might be previous swing highs/lows, daily or weekly levels, or volatility measures such as average true range (ATR).
Common mistakes when trading reversals
Many traders struggle with reversals because they are seductive but unforgiving. Typical mistakes include
- Forcing patterns: Seeing a head and shoulders or double top in every minor fluctuation. If it is not clear, it is probably not worth trading.
- Ignoring the prior trend: Trying to trade a reversal in the middle of a choppy, sideways market where no strong trend exists.
- Entering too early: Guessing the right shoulder or second top before structure confirms, resulting in multiple small losses.
- Oversizing: Treating reversals as guaranteed turning points instead of probabilities, leading to oversized positions and emotional decision-making.
- Neglecting risk management: Failing to define a stop, target, and plan for partial profits before entering the trade.
The solution is discipline: trade only clear patterns, demand confluence, and accept that some setups will fail even when all conditions look ideal.
Conclusion
Reversal patterns are powerful tools for identifying where existing trends may be ending and new ones beginning. Double tops and bottoms, head and shoulders, triple formations and cup and handle structures all represent the same underlying process: a shift in control between buyers and sellers around key levels.
On their own, these formations are just shapes on a chart. Combined with higher-time-frame context, support and resistance, volume and momentum, they become a structured way to anticipate turning points and manage risk around them. Mastery comes not from memorising names, but from understanding the story each pattern tells about exhaustion, failure and transition in the market.
By approaching reversal trading systematically, with clear rules for entries, stops and targets, traders can avoid chasing late trends and instead position themselves early in the next major move.