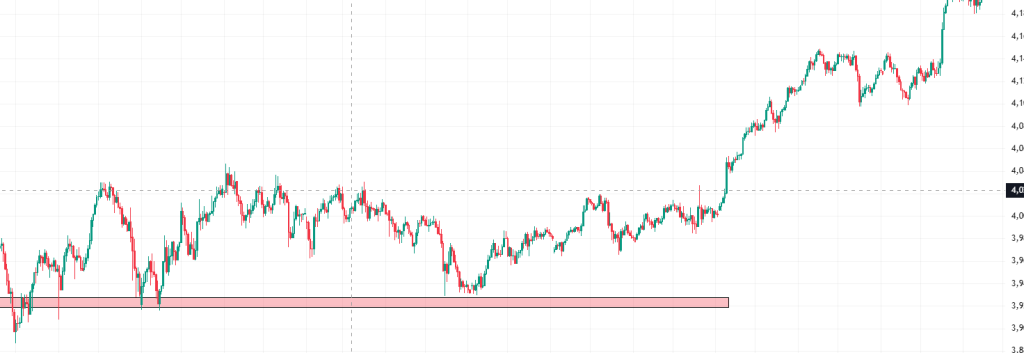
The liquidity test trading strategy is one of the clearest and most reliable ways to understand how modern markets truly move. Instead of relying on indicators or reacting emotionally to every breakout, this method studies how price hunts liquidity, traps participants, and then reveals its intention through a structured sequence of sweeps, rejections and confirmation retests. Traders who master this cycle stop guessing and start reading price as a deliberate process built around liquidity engineering.
At the core of the strategy is a simple insight:
Markets move from one pool of liquidity to the next.
Swing highs, swing lows, stop-loss clusters, psychological round numbers, and previous session extremes act as magnets. Institutions require these pockets to fill large orders, and price often must tap them before continuing in the intended direction.
Understanding this sequence is what transforms liquidity theory into a practical trading framework.
1. Liquidity Zones: Where Every Setup Begins
Liquidity zones are areas where retail traders naturally place stop-loss orders
- Recent swing highs and lows
- Major support and resistance
- Round psychological levels (such as 1.3000, $50, $100)
- Previous day’s high (PDH) or low (PDL)
- Tight consolidation levels
These are predictable, and the market knows precisely where stops are concentrated.
This is why price so often “just barely” breaks a level, triggers the orders, and immediately reverses.
It is not randomness.
It is intentional liquidity harvesting.
2. Liquidity Sweep vs. Liquidity Grab
When price breaks a key level, it usually does so in one of two ways
Liquidity Sweep
Price pushes through a level and lingers briefly, creating the appearance of a breakout.
Liquidity Grab
Price quickly pierces the level with a sharp wick and instantly rejects.
Both actions unlock liquidity behind the level.
But neither one is the entry signal.
They are simply stage one of the process.
3. The First Impulse: Information, Not Confirmation
After the sweep or grab, price often produces a dramatic reaction
- A fast wick
- A sudden spike
- A large engulfing candle
This impulse reveals who has been trapped.
It shows whether breakout traders have been baited and whether trapped sellers/buyers are being forced out.
But smart traders do not enter here.
The first impulse almost always needs confirmation.
4. The Liquidity Test (The Core Signal)
After rejecting the sweep, price typically returns to the level it violated.
This is the liquidity test, the single most important component of the strategy.
Characteristics of a strong liquidity test:
- A clear sweep that takes out a prior high/low
- Instant rejection from that level
- A displacement candle confirming control
- Slow, controlled retrace back to the swept zone
- Reduced volatility on the return
- Rejection wicks or compression on the test
- A continuation candle confirming direction
Only after the test holds does the move become high probability.
This is where professionals enter — not during the sweep, and not during the impulse.
5. Impulse Entry vs. Retest Entry
Both are valid depending on the context.
Impulse Entry
Taken immediately after the rejection.
Pros: early position, best price
Cons: higher risk of manipulation
Retest Entry
Taken after the liquidity test confirms intention.
Pros: structure-based, reliable continuation
Cons: sometimes the market does not return for a test
A hybrid approach — small impulse position + full retest position — is often optimal.
6. Liquidity Sweep vs. Liquidity Run
These two behaviors look similar but mean very different things.
Liquidity Sweep
Price hunts stops → rejects → tests → reverses.
This structure typically marks a reversal setup.
Liquidity Run
Price breaks through → absorbs liquidity → keeps running.
This is trend continuation.
Recognizing the difference prevents both premature fading and false breakout buying.
7. Why Fixed R:R Ratios Don’t Work in Liquidity Trading
Liquidity-based moves do not follow symmetrical geometry.
The next pool of liquidity might be
- Very close
- Far away
- Clustered across multiple levels
Rigid 1:2 or 1:3 models often force traders to ignore what the market is showing.
Liquidity traders prioritize
- Context
- Quality of the sweep
- Strength of displacement
- Behavior of the test
- Location of the next liquidity pool
The structure, not the number, determines the target.
8. Full Workflow Example
A textbook liquidity test setup typically unfolds as
- Price forms a clear high/low with stop clusters behind it.
- Price sweeps the level with a wick (liquidity grab).
- Instant rejection shows strong interest.
- A displacement candle shifts control.
- Price returns slowly to the swept level.
- The liquidity test holds (wicks or compression).
- A continuation candle confirms the direction.
This sequence is not coincidence — it is how modern markets move.
9. Works on Every Timeframe
The liquidity test concept is fractal.
It appears on
The timeframe changes the duration, not the logic.
10. Psychological Benefits of the Liquidity Test Method
Most traders struggle because entries feel uncertain.
The liquidity test removes ambiguity by defining
- Where liquidity rests
- Where manipulation is likely
- Where invalidation sits
- Where confirmation must appear
- Where the next liquidity pool lies
This gives the trader a calm, repeatable framework for execution.
Conclusion
The liquidity test trading strategy offers a complete, structured approach to reading market intention. Liquidity sweeps expose trapped traders. The impulse reveals control. The liquidity test confirms commitment. And the continuation leg delivers the real move.
By aligning entries with institutional behavior rather than noise, traders gain clarity, precision, and a repeatable model that works across all market conditions.