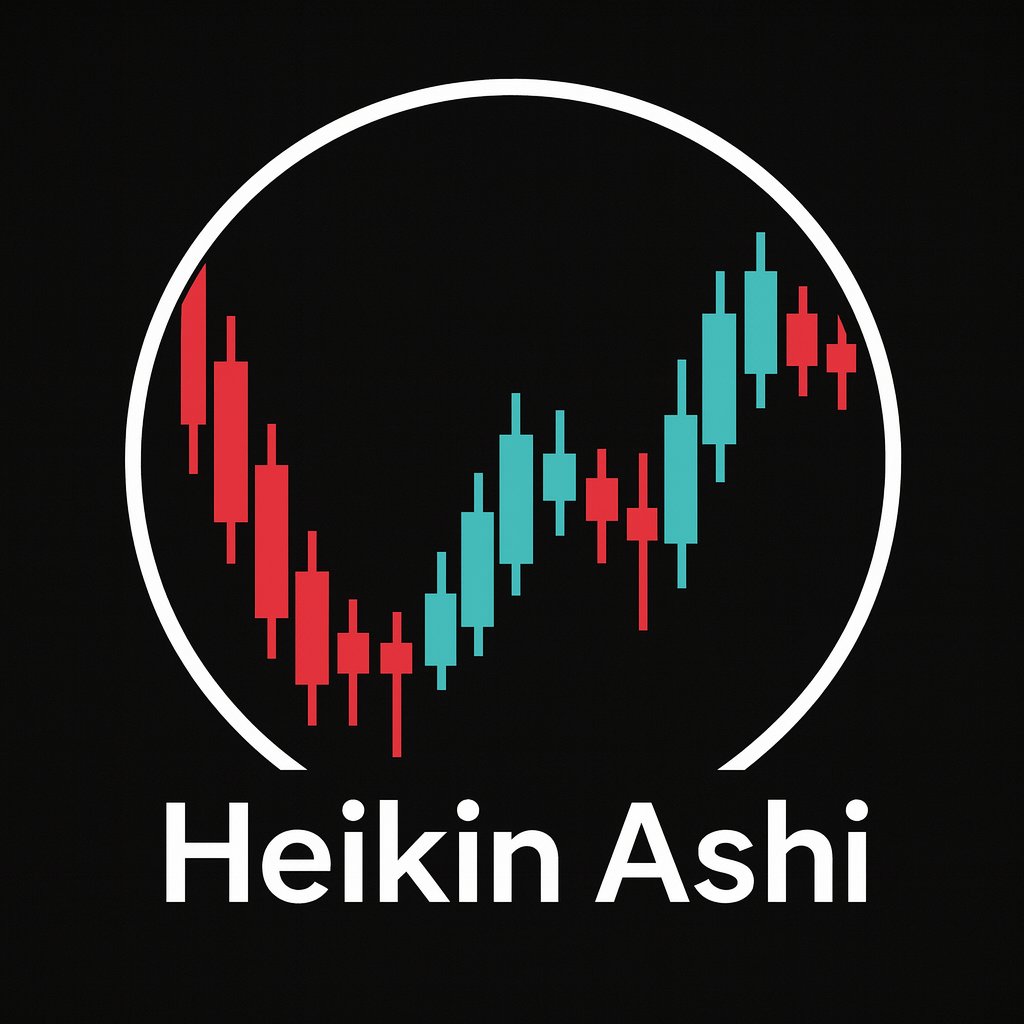
Markets rarely move in straight lines. Normal candlestick charts show every tick of indecision, spike and pullback, which is helpful for detail but exhausting for decision making. Heikin Ashi candles offer a different view of the same market data by smoothing out much of the noise. The idea is not to predict the future but to reveal the underlying direction more clearly so that traders can stay with strong trends and avoid many of the random wiggles.
What are Heikin Ashi candles
The phrase comes from Japanese and is often translated as average bar. Instead of plotting the actual open, high, low and close of each period, this method builds synthetic candles using averages and the values of the previous bar. The result is a chart where trends appear as long sequences of the same colour and pullbacks are less choppy than on a standard candlestick chart.
On a regular candlestick chart each bar stands alone. On this style of chart each bar is linked mathematically to the one before it. That connection is what smooths the swings. It means you lose some precision but gain a clearer visual impression of trend strength and direction.
How Heikin Ashi candles are calculated
You do not need to calculate the values by hand because every modern charting platform can display this candle type. However understanding the logic behind the formulas helps you interpret the signals with more confidence.
| Component | Formula | Meaning |
|---|---|---|
| Close | (open + high + low + close) divided by four | Average price of the current period, similar to a midpoint |
| Open | (previous open + previous close) divided by two | Midpoint of the prior bar, carried forward into the new bar |
| High | Maximum of the current high, current averaged open and averaged close | Highest price reached while respecting the smoothed body |
| Low | Minimum of the current low, current averaged open and averaged close | Lowest price reached while respecting the smoothed body |
The key insight is that the open of each bar no longer jumps randomly with gaps at the start of sessions. Instead it always begins somewhere between the previous synthetic open and close. That creates the familiar stair step effect seen on strong trends and lets the eye follow direction with less distraction.
Recognising trend conditions
Once the candles are constructed the value comes from reading their structure. Several recurring patterns stand out when the market is trending strongly.
- Long consecutive bullish candles with no lower wicks often show a powerful uptrend with buyers in firm control.
- Long consecutive bearish candles with no upper wicks often show a powerful downtrend with sellers in firm control.
- Candles that gradually shrink in size after a long move hint that momentum is fading, even if price continues in the same direction.
- Alternating colours and frequent upper and lower wicks together usually indicate a range or transition phase where trend is weak.
On this type of chart you do not try to read every single candle as a detailed story. Instead you focus on runs, transitions and changes in body size and wick structure. The smoothing removes many false signals, which makes it easier to define simple rules such as holding a trade while there are no opposite coloured candles.
Combining smoothed charts with normal candlesticks
A practical workflow is to keep two charts for the same instrument and timeframe. One is a normal candlestick chart for precise entries, stop levels and profit targets. The other shows the smoothed candles and is used only for bias, trend strength and decisions about holding or exiting trades.
For example a swing trader might scan daily charts that use this method and mark markets where there have been at least five bullish bars in a row with little or no lower wick. That defines a clean uptrend. The trader then drops to a lower timeframe with normal candles to time pullback entries around support, moving averages or intraday structure.
An intraday trader could do the same on hourly charts, keeping trades only in the direction of the smoothed trend and ignoring countertrend setups unless the candles show clear transition behaviour such as colour change and shrinking bodies.
Timeframes and markets where this method works well
Because the calculations use averages, the approach works on any chart that has open, high, low and close data. That includes forex pairs, stock indices, individual shares, commodities and crypto assets. It can be applied to minute charts for scalping, hourly charts for intraday swings or daily and weekly charts for position trading.
The choice of timeframe should match your personality and risk tolerance. Shorter timeframes deliver more signals and more noise, even with smoothing. Higher timeframes move more slowly but offer cleaner structural information. Many traders choose a higher timeframe for directional bias using smoothed candles and execute on a standard chart one or two steps below.
Strengths and limitations
Like any technical tool this method has clear advantages and clear trade offs. Understanding both sides prevents overconfidence and helps you design balanced trading rules.
- Strength: Trends are easier to see, especially in fast or volatile markets where standard candles flip colour frequently.
- Strength: Many small countertrend moves are absorbed into the body of the candle, which can help traders stay in winning trades longer.
- Strength: Visual rules such as exit on first opposite colour become easier to implement consistently.
- Limitation: Exact price levels for entry, stop loss and profit taking are not visible on the smoothed chart because the close is an average, not the market settlement.
- Limitation: During sudden reversals the candles react with a delay, which can cause late exits if you rely on them alone.
- Limitation: In quiet ranges the smoothing provides little benefit and can even hide early signs of a breakout.
Because of these limitations disciplined traders always confirm signals on a standard chart before pressing the order button. The smoothed view is a filter and a context provider, not a stand alone trading system.
A simple trend following approach
One straightforward way to use this candle type is as the backbone of a directional strategy. The trader first defines the higher timeframe trend on smoothed candles, then trades only in that direction on a lower timeframe with normal candles and familiar patterns such as pullbacks, breakouts or reversal structures at support and resistance.
An example rule set might look like this. On the daily chart stay interested only in long setups when there are at least four bullish synthetic candles in a row and the most recent ones have no lower wicks. On the four hour chart wait for a pullback into an old resistance turned support level, then look for bullish confirmation on standard candles such as an engulfing bar or strong rejection wick. The smoothed candles keep you aligned with the dominant pressure while the execution chart handles detail.
Risk management remains unchanged. Stop losses still belong beyond recent structure, position size still depends on account risk per trade, and nothing about smoothing removes the need to accept losing trades calmly. What it can do is reduce the number of impulsive decisions made against the prevailing trend.
Practical tips for daily use
When you first add these candles to your platform it is tempting to throw away normal charts entirely. That would be a mistake. The better path is to treat them as an overlay of information rather than a replacement for the price itself.
- Decide in advance which timeframe and market combination you will watch with this method and avoid constantly switching views.
- Write simple, testable rules for how many same coloured candles you require before considering a trend valid.
- Track screenshots of long sequences of candles and study what happened afterwards to calibrate your expectations.
- Combine the smoothed view with one or two other tools such as support and resistance or a moving average, rather than crowding the screen with many indicators.
Over time you will build an intuitive sense of when a run of synthetic candles is healthy and when it has stretched too far and is vulnerable to a deeper correction.
Conclusion
Heikin Ashi is best seen as a lens rather than a signal generator. By averaging price and linking each bar to the previous one it clarifies trends and momentum swings, helping traders focus on the big picture. Used together with a standard candlestick chart for precise execution it can support clearer decisions, fewer emotional reversals and more consistent trend following behaviour.