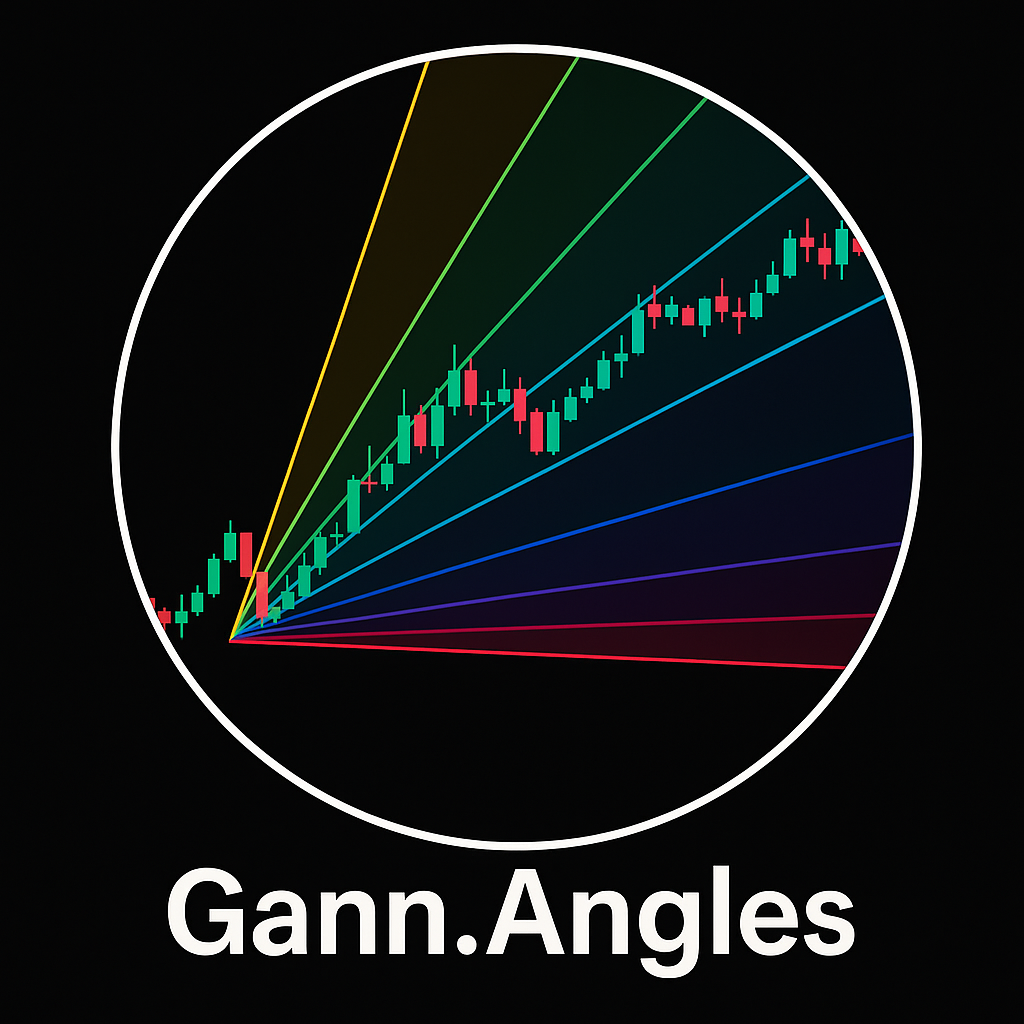
Gann angles and Gann fans sit in that interesting space between geometry and trading. They try to measure not only how far price has moved, but how fast it is moving in time. For a price action trader who already works with clean structure, support and resistance and Darren style intraday execution, Gann tools can act as a secondary grid that helps you judge trend strength, balance and exhaustion.
What are Gann angles and Gann fans
In classic Gann analysis, price movement is evaluated by angles that represent a fixed ratio of price to time. The core idea is that a trend has a natural speed. If you plot that speed as a diagonal line on a correctly scaled chart, you can see when price is running hot above its natural angle or fading below it.
The most famous of these lines is the 1×1 angle. This represents one unit of price per one unit of time. On many charting platforms it is drawn visually as a 45 degree line, but the true definition is mathematical: a constant price to bar ratio, not a cosmetic diagonal rotated on screen.
A full Gann fan takes that 1×1 line and adds steeper and shallower angles, such as 2×1, 3×1, 4×1 and 1×2, 1×3, 1×4. All of these radiate out from a key swing high or swing low. When traders talk about Gann angles they are often referring to this whole family of lines, while the term Gann fans usually refers to the visual tool that draws them as a fan shape on the chart.
Scaling and the 1×1 angle
Gann analysis only makes sense if your chart is scaled correctly. If you zoom in and out freely and the visual slope of your trend changes, then the 45 degree line is meaningless. To respect the original concept you must lock the price to bar ratio in your platform so that one horizontal bar step and one vertical price step maintain a fixed relationship.
Once scaling is locked, the 1×1 angle becomes your baseline. When price trends exactly along this angle from a swing low, it is moving at what Gann would call a balanced speed. If price moves above steeper Gann angles such as 2×1 or 3×1, the trend is running faster than that baseline. If price sinks into shallower angles such as 1×2 or 1×3, the trend is slowing or correcting.
On a practical intraday chart this means that the Gann fan can give you a visual reference for whether current volatility is aligned with recent structure or out of character. This fits nicely with the way Darren style traders already think about average daily range, overextension and pullbacks.
Reading trend strength with the Gann fan
Once you have drawn the Gann fan from a decisive swing low in an uptrend, each angle becomes a potential support line as price pushes higher. The steeper angles mark aggressive phases where buyers are in full control. When price first breaks down from a steep angle to a shallower one, it often signals a loss of momentum rather than an instant reversal.
In a healthy uptrend, price may rotate between two or three of the Gann angles, respecting them as dynamic diagonal support in the same way it might respect a rising channel. When price starts closing below the 1×1 line and cannot reclaim it, you know that the original trend speed has broken. The move might now be transitioning into larger corrective structure or a full reversal.
In a downtrend, everything is mirrored. You draw the Gann fan down from a swing high and read the angles as potential resistance. Strong downside momentum is seen when price respects steeper downward angles like 2×1. A drift back toward shallower lines warns that sellers are losing their grip.
Connecting Gann angles to Darren style trading
Darren style trading is built around clear higher time frame structure, simple moving averages, average daily range and price action triggers such as 2B reversals and three candle reversals. It does not need Gann angles to function. However, Gann fans can add an extra visual layer that supports the way those elements are already used.
Higher time frame structure first
On a pair you actively trade, start with the daily or four hour chart. Mark the obvious swing highs and swing lows that define the current leg. From the dominant swing low in an uptrend, draw a Gann fan that includes at least the 1×1, 2×1 and 1×2 angles. These lines now sit behind your standard support and resistance zones and trend lines.
When you do your top down analysis, note how often price has respected specific Gann angles. Does the current leg keep bouncing off the 2×1 line and respecting the 1×1 as backup? That tells you this trend has been running faster than the baseline and that any test of the 1×1 may be a critical decision area. In Darren language, this often lines up with ADR extremes and prior structure shelves where 2B reversals or three candle reversals like to form.
Intraday execution on lower time frames
When you drop to the execution chart such as M5 or M1, you do not redraw the Gann fan there. Instead, you let the higher time frame Gann angles provide a context. If price is driving into a daily 1×1 or 2×1 angle at the same time it hits a known support or resistance zone and the day has already travelled most of its average range, that is a serious area of interest.
At that point the actual entry is still taken using your normal Darren style triggers. You look for a 2B sweep through the level, a strong engulfing bar in the opposite direction, a three candle reversal sequence or a structure break and retest. Gann angles are not the trigger; they are the background geometry that helps you judge whether this level deserves your focus.
Practical workflow example
Consider a trending forex pair where the daily chart shows a strong leg up from a clear swing low. You draw the Gann fan from that low. Price has been riding the 2×1 angle for several days, respecting it on small pullbacks. The pair then accelerates even more and pierces above that angle, reaching an extended distance beyond the average daily range.
On the following day price fails to hold above that steep angle and starts drifting back toward the 1×1 line. At the same time, you notice that this zone coincides with a prior daily consolidation shelf and a round number level that has previously acted as resistance. In your watchlist notes, you flag this area as a potential buy zone if price pulls back into it and shows strength, or a potential 2B reversal area if price violently spikes through and rejects.
As the session unfolds, the market sells off into that combined zone. On M5, price spikes slightly through the daily 1×1 Gann angle and the support shelf, then prints a sharp rejection candle followed by a three candle reversal pattern. Volume on the rejection is high relative to surrounding bars. In a Darren style plan this is a textbook context for a long: end of intraday liquidation into a higher time frame decision area, with a clean pattern providing the entry trigger.
Your stop sits beyond the extreme of the rejection spike, not beyond the Gann angle. Targets are set using recent structure highs and remaining daily range. The Gann fan simply helped you see that this pullback was still inside the broader balanced leg rather than a full trend collapse.
Common mistakes when using Gann fans
The first mistake is treating Gann angles as magic lines that must cause reversals. They are not objective support and resistance in the way that clearly traded swing highs and lows are. They are a geometric framework for thinking about trend speed. If you forget that, you will chase every touch of a line as a trade, which quickly leads to overtrading and frustration.
The second mistake is ignoring scaling. If your platform does not let you lock the price to bar ratio, the visual 45 degree line called the 1×1 may change slope each time you zoom or scroll. In that case, Gann angles become a cosmetic drawing rather than a consistent measurement. Serious use of Gann angles and Gann fans requires consistent scaling.
A third mistake is letting Gann tools override clean price action. If a fresh low has just broken important weekly support on heavy momentum, but your Gann fan from three months ago happens to sit below price, you should not try to buy that line blindly. Darren style thinking is very clear on this: structure, momentum and context dominate. Any secondary tool must respect those basics.
When to ignore the Gann fan
Sideways markets that chop around a flat range are not the place for Gann analysis. When there is no clear dominant swing and price is pinging back and forth inside the same horizontal band, a diagonal fan adds confusion rather than clarity. In those conditions, trade the range if you must, using simple support and resistance with tight risk, and consider hiding the Gann fan until a new directional leg appears.
News spikes are another place to be cautious. Short lived one candle explosions through all of your Gann angles tell you that a single event has temporarily overwhelmed the normal balance of price and time. After volatility settles, you can redraw from the new major swing, but do not treat the original fan as sacred during the chaos.
Conclusion
Gann angles and Gann fans offer a geometric way to think about the relationship between price movement and time. Used correctly, they help you judge whether a trend is running at a balanced speed, overheating or fading. When combined with solid higher time frame structure, average daily range and clear price action triggers, they can add a useful secondary layer of context to a Darren style trading plan.
They are not a magic system and they should never override obvious support and resistance, momentum or risk management rules. Treated as a background grid rather than a primary signal, Gann tools can help you frame swings, visualise trend health and time your focus on the areas of the chart where high quality setups are most likely to appear.