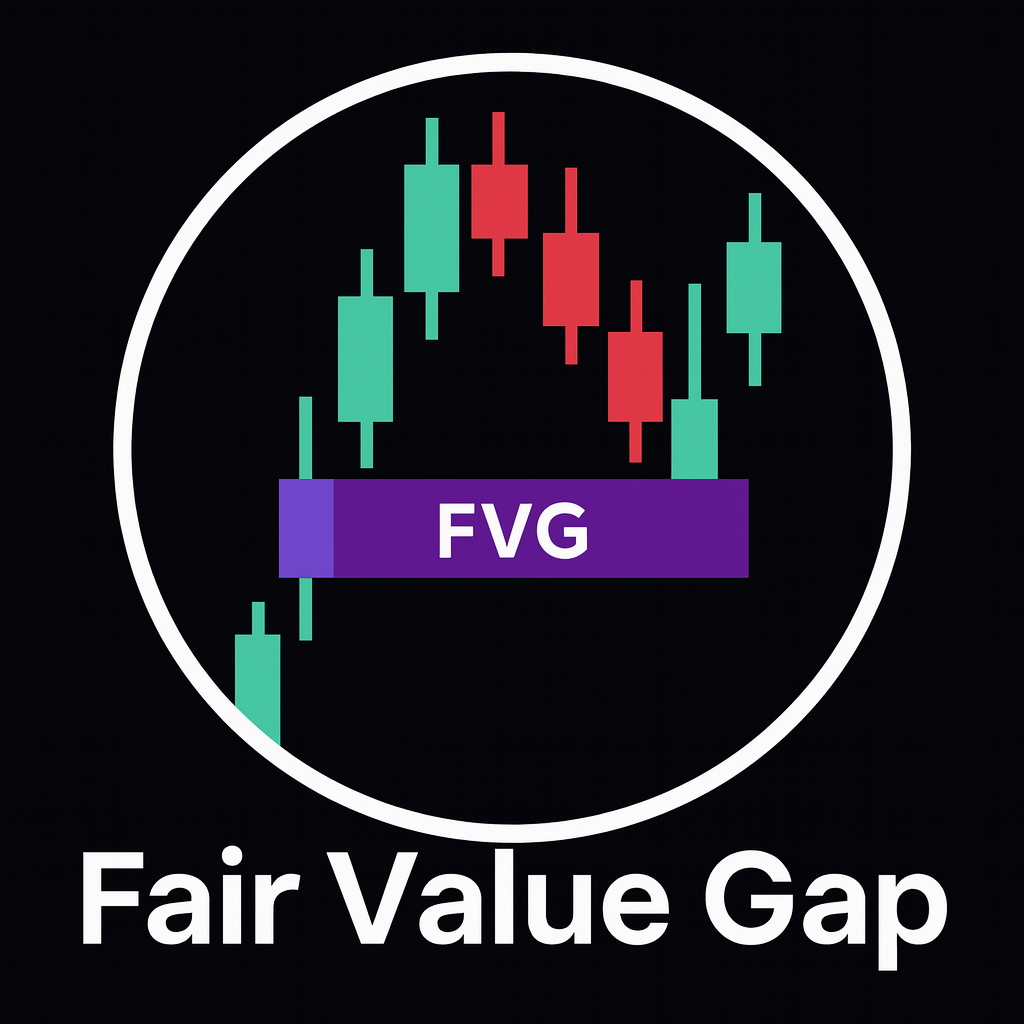
Fair value gaps (FVG) trading guide for price imbalances
Modern price action trading pays close attention to the parts of the chart where price moved too quickly. These fast moves often leave areas where almost nobody traded, creating an imbalance between buyers and sellers. These pockets are called fair value gaps (FVGs), and they can act as magnets that draw price back before the trend continues.
This article explains what a fair value gap is, why it forms, how to identify it step by step, and how traders use it in practical strategies. The goal is not to add another magical indicator, but to give you a structural concept that helps you understand how and where the market might rebalance.
What is a fair value gap?
A fair value gap appears when price moves so aggressively that the normal “auction” between buyers and sellers is skipped. On a candlestick chart this is usually defined using a three-candle sequence
- Candle 1: the starting candle before the impulsive move.
- Candle 2: the large impulsive candle that drives price in one direction.
- Candle 3: the candle after the impulse.
If the wick of Candle 3 does not overlap with the wick of Candle 1, the empty space between them is a fair value gap. It represents a price region where there was almost no two-way trading, only one side in control. The market often revisits this area later to “rebalance” and find fair value.
Bullish and bearish FVG structures
On a bullish impulse, price drives upward quickly
- Candle 1 is a normal candle before the move.
- Candle 2 is a strong bullish candle with a large real body.
- Candle 3 continues higher or at least does not trade back down into Candle 1's wick.
The gap between the high of Candle 1 and the low of Candle 3 is the bullish FVG. Later, if price pulls back into that zone and buyers step in again, the bullish trend may resume.
For a bearish impulse the logic is mirrored. The gap between the low of Candle 1 and the high of Candle 3 becomes a bearish FVG. A retracement into that zone can act as a premium area for new shorts in a downtrend.
Why fair value gaps matter
In a normal, balanced market, price rotates up and down while orders are matched. When a strong imbalance appears, the market speeds through a range of prices. That creates a zone where there was little or no competition between buyers and sellers. Later, institutional traders may return to that zone to fill leftover orders or to rebalance their exposure.
For the active trader, this behaviour can be useful. Fair value gaps tend to act as
- Magnets: price can be drawn back into the gap after an extended run.
- Reaction zones: when price retests the gap, you often see sharp reactions.
- Reference levels: they provide objective, visually clear zones to plan trades around.
Used correctly, fair value gaps help you avoid chasing impulsive candles and instead focus on pullbacks into logical value areas.
How to identify a fair value gap step by step
You do not need any indicator to spot these imbalances. A simple, repeatable process is enough
- Select a timeframe: many traders start from the H4, H1 or M15 charts. Lower timeframes like M1 or M5 will show many small gaps, so context is essential there.
- Find impulsive candles: look for large candles compared to their neighbours, with strong directional bodies and small wicks on the opposite side.
- Check the neighbouring candles: identify Candle 1 (before the impulse) and Candle 3 (after the impulse). Compare their wicks.
- Confirm the gap: if the wick of Candle 3 does not overlap Candle 1, the open space between them defines the FVG.
- Mark the zone: draw a rectangle from Candle 1's wick to Candle 3's wick so the box highlights the gap across future candles.
Once marked, the rectangle becomes a tradable zone. You can then watch for retracements into that zone and combine it with your existing tools such as support and resistance, Fibonacci retracements or moving averages.
Trading strategies using fair value gaps
Trend continuation from a fair value gap
One of the most common strategies is to trade in the direction of the prevailing trend using the gap as a discount or premium area. In an uptrend you focus on bullish FVGs; in a downtrend you focus on bearish ones.
A typical bullish continuation plan might look like this
- Higher-timeframe structure (for example, D1 and H4) is clearly bullish.
- On H1 there is a sharp bullish impulsive move that creates an FVG.
- Price later pulls back into the FVG while higher-timeframe support remains intact.
- You wait for a lower-timeframe bullish signal inside the gap area, such as a rejection wick or small reversal pattern, and then enter long.
- Your stop is placed below the gap or below the structural low beyond it, with targets at recent highs or higher-timeframe resistance.
Using confluence with other tools
Fair value gaps are rarely used in isolation. They’re most effective when they line up with other elements of your trading plan
- Support and resistance: a gap that sits on top of a well-respected support level is more meaningful than one in the middle of nowhere.
- Fibonacci retracements: many traders watch for the gap to sit near the 38.2%–61.8% retracement of the prior swing.
- Supply and demand zones: an FVG nested inside a higher-timeframe supply or demand area provides a structured place to refine entries.
- Moving averages: dynamic support or resistance (for example, a widely used EMA) cutting through the gap adds another layer of confidence.
- Session timing: reactions during active sessions, such as London or New York, typically carry more weight than movements during thin liquidity hours.
Counter-trend scalps from extended moves
Some experienced traders use clusters of fair value gaps to fade exhausted moves. For example, after a long downtrend with multiple bearish FVGs stacked on top of each other, a sharp reversal through the lowest gaps can signal that the selling imbalance has been fully unwound.
This style is more aggressive and requires precise timing, strict stops and a clear understanding of higher-timeframe context. For most traders, focusing on trend-following setups is more robust than systematically fading strong impulses.
Multi-timeframe use of fair value gaps
Because price imbalances occur on every timeframe, traders often combine them in a top-down approach
- Higher timeframe FVGs (weekly, daily, H4) act as large “magnets” that price may gravitate toward over many sessions.
- Lower timeframe FVGs (H1, M15, M5) help refine entries and exits within those bigger zones.
One effective workflow is to mark daily or H4 fair value gaps as higher-level zones, then drop down to H1 or M15 to look for fresh FVGs and reversal patterns as price taps into the larger area. That way, you are trading in line with the bigger picture while still getting precise intraday entries.
Risk management around FVG trades
No concept, including fair value gaps, removes the need for risk management. A clear plan should cover
- Stop placement: many traders place stops just beyond the far edge of the gap or beyond the nearest structural swing.
- Position sizing: the distance from entry to stop determines how large your position can be for a fixed percentage risk.
- Partial profits: taking partial gains at logical levels (previous highs or lows, opposing FVGs, or key structure) helps lock in profit.
- Invalidation criteria: if price fully fills the gap and then breaks structure against your trade, the idea is no longer valid and you exit.
Common mistakes when trading FVGs
Beginners often misuse fair value gaps in ways that damage their results. Typical errors include
- Seeing gaps everywhere: forcing the pattern on every three candles instead of focusing on meaningful impulses.
- Ignoring the trend: trying to trade every FVG in both directions instead of aligning with higher-timeframe structure.
- Entering blindly on first touch: assuming that the first tap of the gap will always hold, without looking for confirmation or sufficient liquidity.
- Using arbitrary stops: placing stops inside the gap where random noise can easily hit them.
- Overleveraging: treating fair value gaps as guaranteed reversal or continuation zones instead of probabilistic edges.
Simple reference table for FVGs
| Type | Direction | Entry zone | Typical invalidation |
|---|---|---|---|
| Bullish FVG | Buy in uptrend | Pullback into gap from above | Close below gap and broken bullish structure |
| Bearish FVG | Sell in downtrend | Retrace into gap from below | Close above gap and broken bearish structure |
Conclusion
Fair value gaps are a visual expression of imbalance in the auction process of the market. They highlight where price moved too quickly, leaving behind a pocket that may later be revisited. When combined with higher-timeframe structure, support and resistance, and disciplined risk management, fair value gaps can provide clean, logical entry zones instead of emotional chases.
Used on their own they are just empty boxes on a chart. Used as part of a complete, rules-based plan they help you slow down, wait for price to come to you, and participate in moves from areas where the market is genuinely interested in doing business.