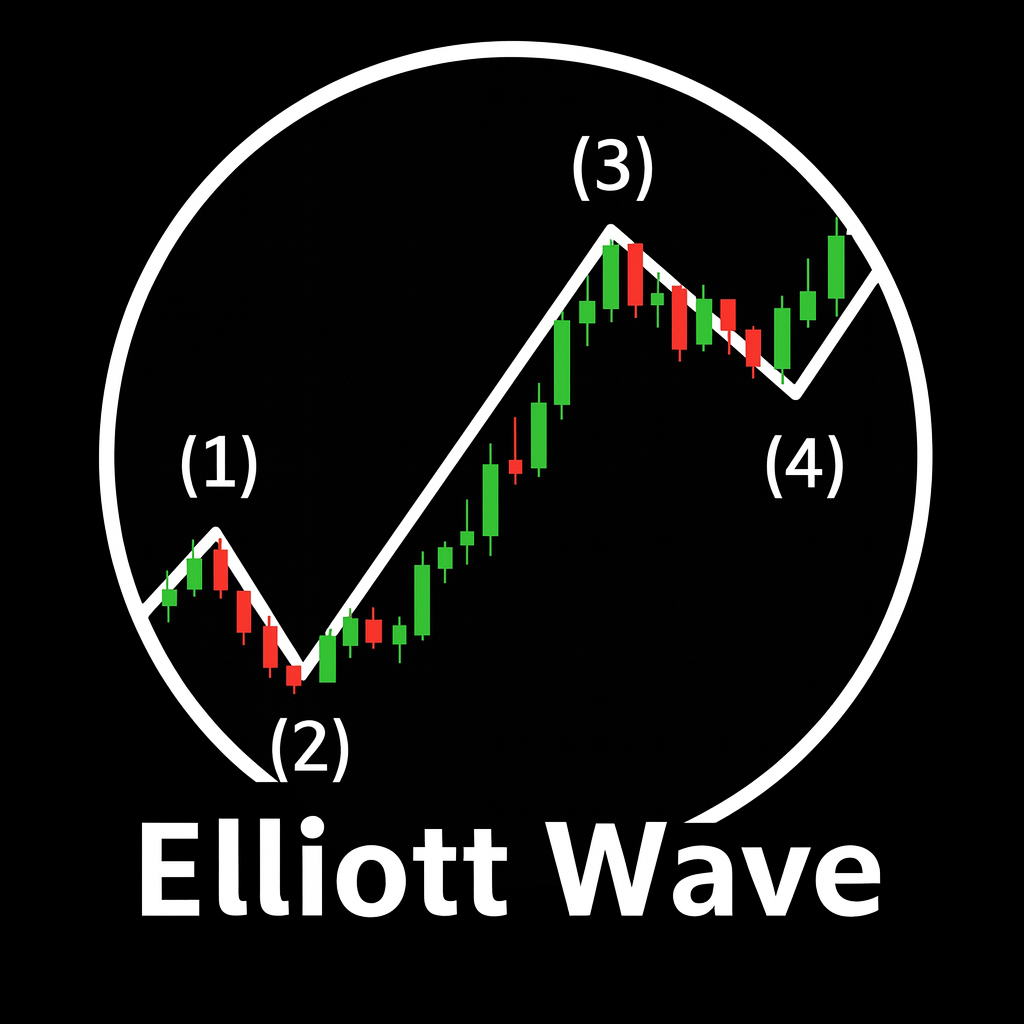
Elliott Wave theory is a structural framework that describes how price trends unfold in waves. Instead of seeing the market as random, it assumes that crowd psychology repeats in recognizable patterns. The most important of these patterns is the classic five-wave impulse in the direction of the main trend, followed by a three-wave correction against it. Traders use this structure to understand where the market is in a cycle and to locate higher probability entries and exits.
The Core Five-Wave Impulse
In its simplest form, a bullish Elliott Wave sequence starts with a five-wave impulse labeled 1, 2, 3, 4 and 5. Waves 1, 3 and 5 move in the direction of the trend, while waves 2 and 4 are corrective pullbacks. The same logic applies in reverse for a bearish trend, with the impulse moving down and corrections moving up.
Each leg of the five-wave structure reflects a stage of trader participation and market psychology. Wave 1 is often the early move when the new trend begins. Wave 2 is the first pullback as traders doubt the new direction. Wave 3 is usually the strongest leg when the majority finally recognize the trend. Wave 4 is a pause for profit taking, and wave 5 is the final push that completes the impulse before a larger correction starts.
Key Elliott Wave Rules for Impulse Waves
There are several core rules that define a valid five-wave impulse. These rules are not optional guidelines; if they are broken, the wave count is invalid and must be reconsidered. The most important ones are
| Wave | Core Rule | Common Behaviour |
|---|---|---|
| Wave 1 | Starts the trend from a previous swing extreme | Can be sharp or choppy, often not obvious in real time |
| Wave 2 | Cannot retrace beyond the start of wave 1 | Frequently retraces deeply, often near the 0.618 Fibonacci level |
| Wave 3 | Must not be the shortest of waves 1, 3 and 5 | Usually shows strongest momentum and volume, often extended |
| Wave 4 | Typically stays above the top of wave 1 in an uptrend | Often a shallow consolidation near the 0.382 Fibonacci retracement |
| Wave 5 | Completes the impulse structure | Can show divergence in momentum indicators and exhaustion signs |
These rules give Elliott Wave analysis its structure. For example, if a supposed wave 2 retraces all the way back through the start of wave 1, the count is wrong. Likewise, if what you labeled as wave 3 turns out to be the smallest impulse leg of the three, the labeling is inconsistent with Elliott Wave theory and must be revised.
The A–B–C Corrective Structure
After the five-wave impulse completes, markets typically develop a three-wave correction labeled A, B and C. In a bullish cycle, this correction moves downward against the prior uptrend. Wave A starts the countertrend move, wave B is a partial retracement that often tricks traders into thinking the main trend has resumed, and wave C is a final push in the corrective direction.
Corrective patterns can become complex, with variations such as flats, zigzags and triangles. However, many practical traders focus on the simplest version: a clear three-leg move that ends near a logical support or resistance area. The key objective is not to label every sub-wave perfectly, but to recognize when a correction is maturing and the larger trend is likely to resume.
Using Fibonacci Levels with Elliott Wave
Fibonacci retracements fit naturally into Elliott Wave analysis. In many charts, wave 2 often pulls back towards the 0.618 retracement of wave 1, while wave 4 frequently stalls near the 0.382 retracement of wave 3. These are not guarantees, but they create a logical zone where traders expect a reaction.
One common workflow is to identify a potential wave 1 swing, then draw Fibonacci retracements from the start of wave 1 to its end. If price declines towards the 0.5 or 0.618 region and then prints strong reversal candles, that area becomes a candidate for a wave 2 low. Similarly, Fibonacci extensions can be used to project targets for wave 3 and wave 5 based on the size of earlier waves.
Practical Trading Approaches with Elliott Wave
There are two main tactical entry ideas that appeal to many traders using Elliott Wave. The first is to participate in wave 3, the trend acceleration leg. The second is to position into wave 5, the final impulse before a larger correction.
Targeting Wave 3
Wave 3 is usually the most powerful part of the trend, often accompanied by strong momentum, widening ranges and higher volume. A practical approach is
- Identify a potential wave 1 and wait for a pullback that could be wave 2.
- Use Fibonacci retracements and support levels to define a buy or sell zone for the end of wave 2.
- Look for a clear signal that the corrective move is ending, such as a rejection wick, engulfing candle or momentum indicator turn.
- Enter in the direction of the main trend with a stop beyond the wave 2 low or high.
If the wave count is correct, the next leg should be wave 3, offering a strong directional move with favourable reward to risk. If price fails and breaks through the wave 2 extreme, the count is invalidated and the risk is contained by the stop loss.
Trading Wave 5 and the Final Push
Some traders prefer to trade wave 5, the last impulse leg. By the time wave 4 is forming, the trend structure is more obvious. A consolidation near the 0.382 retracement of wave 3, combined with ongoing higher time frame support, can provide a structured entry for the final push.
However, wave 5 is often less reliable than wave 3. It can truncate, meaning it fails to exceed the high or low of wave 3, or it can complete quickly and reverse sharply. Momentum indicators frequently show divergence in wave 5, with price making a new extreme but indicators failing to confirm. For this reason, conservative traders often take partial profits aggressively during wave 5 and monitor for signs of a larger A–B–C correction starting.
Risk Management and Common Pitfalls
Elliott Wave theory is appealing because it offers structure and clear rules, but it is easy to misuse. The biggest risk is forcing a wave count onto random price action. In live markets, swings rarely match textbook diagrams. If you insist on labeling every move, you can end up with a complex story that does not improve your trading decisions.
Sound risk management is therefore critical. Every Elliott Wave scenario should have a clear invalidation point where the count is proven wrong. Stops should be placed beyond levels that, if broken, contradict the assumed structure, such as the start of wave 1 for a supposed wave 2 low. Position sizing should be based on the distance to this invalidation, not on the excitement around a potential wave 3 or wave 5 move.
Another common mistake is ignoring the higher time frame. An attractive five-wave pattern on a small intraday chart may sit inside a messy corrective structure on the daily chart. Higher time frame context usually dominates and should guide your bias. Many traders use Elliott Wave only on the daily or four-hour chart and then drop to lower time frames to fine tune entries and exits.
Keeping Elliott Wave Simple
Because Elliott Wave can become extremely detailed, many practical traders intentionally keep it simple. Instead of memorizing dozens of pattern variations, they use the basic idea of a five-wave impulse and a three-wave correction as a broad map. They mark potential wave 1 and wave 2 zones, project wave 3 and wave 5 targets, and look for the A–B–C correction to offer a fresh continuation opportunity.
In this simplified approach, the goal is not to be perfectly correct in every label. The goal is to align with the main trend, trade from logical support and resistance levels, and use the Elliott Wave structure to avoid chasing late moves. If price has already completed five clear pushes and momentum is fading, a new breakout entry may be less attractive. If price is only in a potential wave 2 pullback within a strong trend, a continuation trade into wave 3 might offer a better probability profile.
Used this way, Elliott Wave becomes one layer in a broader decision framework alongside price action, support and resistance, and tools like Fibonacci retracements. It provides a narrative for where the market might be in its cycle without becoming the only deciding factor.
Conclusion
Elliott Wave theory describes how trends develop in a five-wave impulse followed by a three-wave correction. The essential rules, such as wave 2 not retracing beyond the start of wave 1 and wave 3 not being the shortest impulse leg, give structure to what might otherwise look like random swings. When combined with Fibonacci levels, higher time frame support and resistance, and disciplined risk management, Elliott Wave offers a useful framework for understanding market phases and planning trades.
By focusing on the core impulse and correction structure, rather than getting lost in complex variations, traders can use Elliott Wave to identify likely acceleration phases and exhaustion points. The result is not a perfect prediction tool, but a structured way to read market psychology and align trades with the dominant trend.