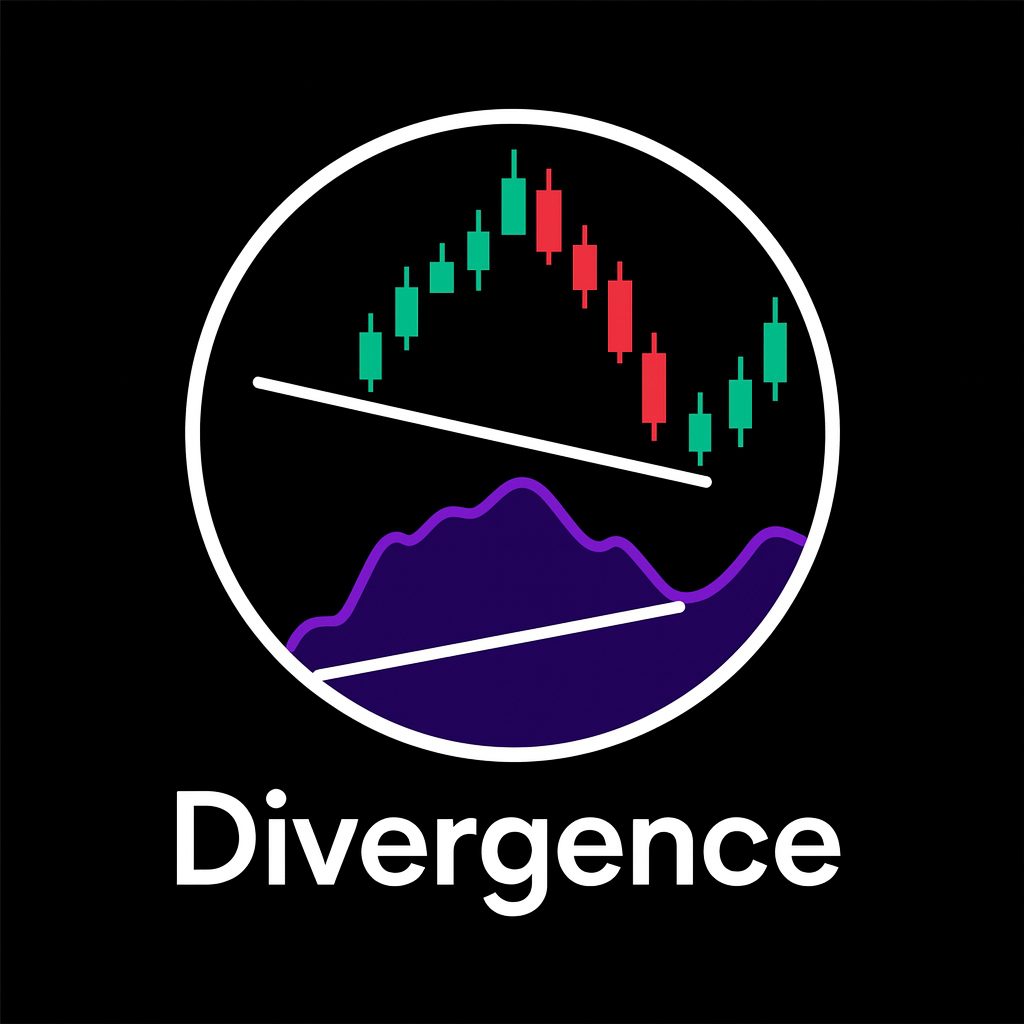
Divergence is the quiet disagreement between price and your indicator. Price is saying one thing, momentum is saying another. When you learn to read that disagreement inside trend structure, channels, support and resistance, and across multiple time frames, divergence stops being a toy pattern and becomes a serious decision tool.
What is divergence in trading?
At its core, divergence is simple. Price makes one kind of extreme, your indicator makes the opposite
- Price makes higher highs but the indicator makes lower highs: bearish divergence.
- Price makes lower lows but the indicator makes higher lows: bullish divergence.
The indicator is usually a momentum oscillator: RSI, stochastic, MACD histogram, CCI, Awesome Oscillator, or something similar. These tools compress price action into a single line, so it becomes obvious when the strength of a move is no longer matching the distance price is travelling.
The key point: divergence is a warning, not a trigger. It says the current drive is running out of fuel. It does not say when the turn will actually happen. That timing must come from structure, levels, and price action.
Regular vs hidden divergence
Regular divergence: fading the move
Regular divergence is the classic textbook pattern used to anticipate reversals.
- Bearish regular divergence: price prints higher highs; your indicator prints lower highs. The trend is still grinding up, but each push has less momentum. Sellers are quietly gaining ground.
- Bullish regular divergence: price prints lower lows; your indicator prints higher lows. The trend is still grinding down, but each flush has less power. Buyers are starting to absorb the selling.
Regular divergence makes the most sense at obvious resistance or support zones, the tops or bottoms of channels, or after an extended trend leg. You are not just shorting because you saw a divergence. You are shorting because you are at a logical area where a turn makes sense, and divergence confirms that the engine behind the previous move is weakening.
Hidden divergence: trend continuation fuel
Hidden divergence is less famous but more powerful in trending markets because it aligns with the trend instead of fighting it.
- Hidden bullish divergence: price makes a higher low, but the indicator makes a lower low. Structure says the uptrend is intact; momentum says the pullback was strong but could not break structure.
- Hidden bearish divergence: price makes a lower high, but the indicator makes a higher high. Structure still favours the downtrend; the correction had strong momentum but failed to flip the trend.
Hidden divergence is your friend when buying pullbacks in an uptrend or selling rallies in a downtrend. It acts like a filter that says: this retracement was strong enough to shake people out, but not strong enough to break the trend.
Which indicators work best for divergence?
You can theoretically use any oscillator to spot divergence, but some tools are more convenient
- RSI: clean, bounded between 0 and 100, easy to read, excellent for both regular and hidden divergence.
- MACD histogram: visualises momentum waves well; peaks and troughs are obvious, helpful on higher time frames.
- Stochastic: reacts quickly; good for fast intraday charts, but noisy if your settings are too aggressive.
- Awesome Oscillator or CCI: useful for traders who like histogram style views of momentum swings.
The smart move is to master one indicator, not five. Divergence trading does not become better because you stack indicators. It becomes better because you understand where on the chart divergence matters and where it is just background noise.
Divergence inside trend channels
Divergence grows teeth when you combine it with channels. A trend channel is simply a diagonal corridor drawn by connecting swing lows in an uptrend and copying that line to the swing highs, or the reverse in a downtrend.
Uptrend channels
In an uptrend channel, think in three layers
- Channel direction: the overall path is up. Higher highs and higher lows define the bias.
- Interaction with edges: each touch of the upper or lower boundary gives you context on where you are in the swing.
- Divergence at edges: now overlay your divergence indicator.
Useful patterns include
- Price tags the upper channel line, makes a higher high, but RSI or MACD makes a lower high: classic place to look for a short back towards mid channel or the lower boundary.
- Price dips to the lower channel line, makes a marginal lower low inside the channel, but the indicator prints a higher low: bullish regular divergence inside an overall uptrend, often a strong continuation entry.
- Price pulls back to the midline or a dynamic moving average inside the channel and forms hidden bullish divergence: strong sign that the pullback is likely to end and the trend to resume.
Downtrend channels
In a downtrend channel, invert the logic
- Price spikes into the upper channel boundary with lower highs on the indicator: hidden bearish divergence and continuation potential.
- Price makes a marginal lower low at or just outside the lower channel line while the indicator fails to make a new low: regular bullish divergence suggesting exhaustion of the current leg.
By combining divergence with channel edges, you move from trading random indicator disagreements to trading structured tests of supply and demand inside a controlled framework.
Support, resistance, and supply and demand zones
Divergence is at its best when it lines up with horizontal structure. Think of three main structures
- Horizontal support and resistance levels drawn from repeated swing highs or lows.
- Supply and demand zones built from consolidation areas before strong moves.
- Round numbers and session highs or lows where crowd psychology is concentrated.
Examples of high quality ideas
- Price retests a weekly resistance zone, forms a second high slightly above the first, but RSI prints a clear lower high: bearish divergence at a major line in the sand.
- Price flushes through a known demand zone, makes a lower low, but the indicator makes a higher low, and price quickly snaps back above the zone: bullish divergence plus a failed breakdown.
- Price grinds into a daily supply block with shrinking candles and multiple bearish divergences on the four hour chart: signs that larger players may be taking profits.
Support and resistance tell you where the battle matters. Divergence tells you which side is quietly losing strength.
Multi time frame divergence workflows
Divergence becomes far more reliable when you do not lock yourself into a single time frame. The basic idea is simple: use higher time frames for bias and location, lower time frames for timing.
Top down example
- Start on the daily chart: mark obvious support, resistance, and major channels. Note any big daily divergences that suggest exhaustion of a major swing.
- Drop to the four hour chart: refine trend lines, channels, and supply and demand zones. Watch for regular or hidden divergence as price interacts with the daily levels you drew.
- Go to the one hour or fifteen minute chart: when price arrives at a higher time frame level and you see divergence starting to appear, look for confirmation from price action: engulfing candles, breaks of minor structure, or micro channels breaking.
- Fine tune entries on the five minute or one minute chart if you are an intraday trader. Use local divergence and micro structure for entry and precise stop placement while the bigger picture guides direction and targets.
The principle remains: higher time frame divergence tells you that a big leg is tired or that a deep pullback in trend may be ending. Lower time frame divergence helps you stop guessing the exact candle and instead wait for clear local imbalance near those levels.
Building a practical divergence trading plan
A divergence trading plan should be boringly systematic. One example template
- Choose one instrument group you understand well: major forex pairs, a handful of indices, or a small basket of liquid stocks or crypto.
- On the daily chart, mark the obvious levels and channels. Decide whether the market is trending or ranging.
- Define allowed directions per instrument for the day based on higher time frame trend. For example, only long trades in a strong daily uptrend unless there is massive weekly bearish divergence at all time highs.
- Wait for price to approach a level that matches your plan: channel boundary, support, resistance, or a supply and demand zone.
- As price interacts with that level on the four hour and one hour chart, check your chosen indicator for regular or hidden divergence that fits your directional bias.
- Once divergence appears, do not enter blindly. Wait for a break of minor structure, a convincing candle pattern, or a retest and rejection of the level.
- Place stops beyond the structure that would invalidate the idea: above the swing high for a short, below the swing low for a long, not just a few random points away.
- Set targets at logical opposing structures: mid channel, opposite channel boundary, or previous support and resistance zones. Use partial profit and break even management if your style requires it.
This process anchors divergence trading in reality: levels first, structure second, divergence as confirmation, price action as trigger.
Common mistakes with divergence
Most traders misuse divergence in predictable ways
- Countertrend addiction: trying to short every new high just because the indicator is overbought and diverging, ignoring that strong trends can hold divergence for a long time.
- Forcing patterns: drawing divergence between random swing points that are not real structural highs or lows, just noise inside a range.
- Ignoring context: taking a bullish divergence in the middle of a clean downtrend with no support, simply because the pattern exists on the indicator.
- Indicator clutter: stacking multiple oscillators that all show the same thing instead of improving the logic of entries and exits.
- No statistics: never checking how often a given divergence pattern actually works on their instrument and time frame, so they do not know whether their idea has any edge.
Fixing these errors usually means stripping the chart back to clean price, levels and one indicator, then rebuilding rules that can be tested and refined.
Advanced tweaks and optimisations
Once you have a basic divergence strategy, you can refine it with a few advanced edges
- Combine with volatility: use ATR or a volatility measure to size stops and targets, so your divergence trades adapt to quiet and fast markets.
- Session filters: on intraday charts, focus on times when liquidity is highest and divergence has meaning, such as London and New York sessions for forex.
- Event awareness: avoid taking fresh divergence trades just before major economic releases that can blow through levels without respect.
- Data logging: record every divergence setup you trade: type, direction, time frame mix, outcome, and maximum excursion. Over a sample of trades, patterns will appear that let you sharpen your rules.
These tweaks do not change the essence of divergence trading; they simply make it more robust and measurable.
Conclusion
Divergence is not magic. It is a precise way of saying that the energy behind a move is out of sync with the distance price is travelling. When you place that information inside trend channels, support and resistance, and a clear multi time frame framework, divergence becomes one of the most useful confirmation tools on your screen. Treat it as a structured warning, combine it with disciplined execution, and it can turn messy momentum into clear, tradable stories.