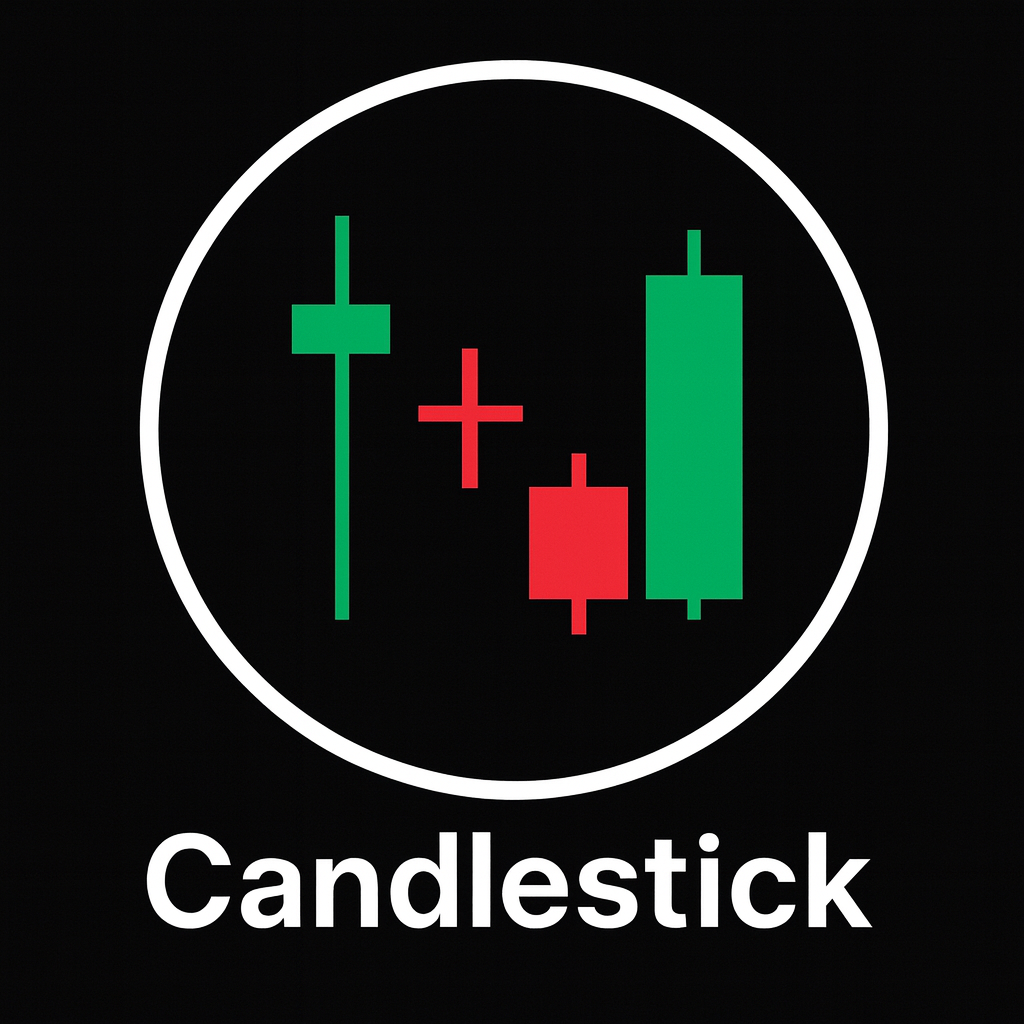
Candlestick charts are one of the most compact ways to see what buyers and sellers have done during a given period. Each candle condenses open, high, low and close into a visual story. When you study how candles cluster and interact at important prices, you start to see recurring candlestick patterns that hint at continuation, reversal, or indecision. Used correctly, they are not magic signals, but powerful context for decision making in forex, crypto, indices or stocks.
How candlesticks encode order flow
Every candle reflects a mini battle between buyers and sellers over a chosen time frame, such as one minute, one hour or one day. The open shows where that battle began, the high and low show the most extreme attempts in both directions, and the close marks where the market finally agreed to stop for that period. The shape and size of the body and wicks tell you who was in control and how stable that control was.
A long bullish candle with little or no wick at the top suggests that buyers dominated from open to close and were willing to pay increasingly higher prices. A long bearish candle shows the opposite: persistent selling pressure. Long wicks indicate rejection. A long lower wick tells you that sellers pushed price down but buyers strongly rejected those lower prices. A long upper wick shows the rejection of higher prices.
Candlestick patterns simply arrange these basic elements into repeatable configurations: large bodies swallowing smaller ones, small bodies with long shadows, or candles with almost no body at all. The pattern itself is less important than the story of who tried to do what and who ultimately won.
The role of context in candlestick patterns
Candlestick patterns gain or lose meaning depending on where they occur. The same hammer candle in the middle of a noisy sideways market is just random fluctuation, but a hammer after a persistent downtrend into a weekly support level is a very different story. The context usually includes three elements
- Trend: Is the market generally trending up, trending down, or ranging?
- Key levels: Are we sitting on an obvious support, resistance, previous swing high/low, or round number level?
- Momentum and volatility: Are candles expanding in size with strong closes, or shrinking with overlapping wicks?
Professional traders rarely trade a candlestick pattern in isolation. Instead, they pre-mark important levels and zones, then use patterns as confirmation that the market is reacting to those levels. Candlestick patterns, in other words, should answer the question: are participants accepting this price area or rejecting it?
Engulfing patterns: strong shifts in control
Engulfing patterns are among the most widely used candlestick patterns because they are easy to see and represent a clear shift in control. An engulfing pattern consists of two candles. The second candle’s real body completely covers the real body of the first one.
Bullish engulfing pattern
A bullish engulfing pattern typically forms after a decline or at the bottom of a pullback. The first candle is usually bearish, showing continuation of selling pressure. The second candle opens near or below the prior close and then rallies strongly to close above the first candle’s open, swallowing its body.
The message is that sellers initially seemed in charge, but buyers stepped in aggressively and overwhelmed them. This can mark the start of a larger bounce or the continuation of an existing uptrend after a corrective dip.
Bearish engulfing pattern
A bearish engulfing pattern is the mirror image. It typically appears after an advance or at the top of a pullback in a downtrend. The first candle is bullish, suggesting buyers still have the upper hand. The second candle opens near or above the prior close, then sells off and closes below the first candle’s open.
This shows that buyers pushed price higher but were overwhelmed by a wave of selling. At meaningful resistance or after an extended rally, this can mark the start of a deeper correction or the resumption of a broader downtrend.
Trading engulfing patterns with structure
On their own, engulfing patterns produce many false signals. They become more reliable when combined with structure
- Look for bullish engulfing patterns at or near clear support zones, such as previous swing lows, demand areas or major moving averages.
- Look for bearish engulfing patterns near resistance zones, such as previous highs, supply areas or long-term trend lines.
- Use volume or volatility as a filter. Strong engulfing patterns often occur with above-average activity or a noticeable expansion in candle range.
- Define invalidation. If price trades below the low of a bullish engulfing pattern (or above the high of a bearish one), the signal has failed and the premise is invalid.
Hammer and shooting star candles: rejection tails
Hammer and shooting star candles are single-candle patterns that highlight strong rejection of lower or higher prices. Both have a small real body and a long wick on one side.
Bullish hammer
A bullish hammer appears after a decline. It opens, sells off sharply, then reverses and closes near the high of the candle, leaving a long lower shadow and a small body at the top. This shows that sellers had control early in the period, but buyers stepped in with enough force to erase most or all of those losses.
At major support, a hammer suggests a potential exhaustion of selling and the willingness of larger players to absorb supply. The best hammers often form after a series of lower lows when sentiment is stretched and liquidity thins out below obvious levels.
Shooting star
A shooting star is the bearish counterpart and typically forms after a rise. Price opens, rallies sharply, then reverses and closes near the low, leaving a long upper wick and a small body at the bottom. Buyers tried to push price up, but sellers rejected those higher levels aggressively.
At resistance, a shooting star signals that upside momentum may be fading and that profit taking or fresh short selling is entering the market.
Using hammer and shooting star candles
Trading these patterns requires patience and rules
- Always define the context first: strong prior trend into a level, not a random candle in sideways chop.
- Wait for the candle to close. Intrabar price swings can make a temporary hammer that disappears before the period ends.
- Use the tail as a reference. For a bullish hammer, a stop loss often goes below the low of the wick. For a shooting star, stops can go above the high.
- Combine with confluence such as Fibonacci retracement levels, moving averages or prior supply and demand zones.
Doji candles: indecision and balance
Doji candles are defined by very small real bodies where the open and close are at or near the same level. Wicks may be short or long. A doji by itself does not say whether buyers or sellers are stronger; instead, it reveals hesitation, balance or a pause in conviction.
In a strong trend, a single doji may simply signal a brief pause before continuation. However, repeated doji candles in a tight range after a strong move can highlight a more meaningful shift, suggesting that the prior trend is losing energy as both sides reassess fair value.
At key levels, a doji can serve as a warning sign that the market is unsure how to proceed. For example, a doji at multi-month resistance after a sustained rally indicates that buyers are no longer in a hurry to pay higher prices, even if sellers have not fully taken control yet.
Because doji patterns are neutral, most traders do not trade them directly. Instead, they wait for a follow-up candle that breaks out of the doji’s range. A strong close above the high or below the low of the doji can provide a continuation or reversal entry with tightly defined risk.
Building a framework around candlestick patterns
Candlestick patterns work best when embedded inside a structured trading process. A practical framework might include
- Top-down analysis: Start from the higher time frames to identify the main trend and major support and resistance levels. Mark these zones before looking at patterns.
- Execution time frame: Choose one or two lower time frames (such as H1 or M15) where you will actually enter trades. This is where you read individual candles most closely.
- Trigger patterns: Use engulfing patterns, hammers, shooting stars and doji-based breakouts as potential triggers when they appear at your pre-marked levels.
- Risk management: Decide in advance how much you are willing to risk per trade and where you will place your stop relative to the candle pattern.
- Trade management: Plan partial profits, trail stops or exit conditions based on structure, not emotion.
In forex and crypto, where price can be noisy and liquidity varies across sessions, this structure prevents overreaction to every interesting candle. Candlestick patterns become signals only when the larger picture supports them.
Common mistakes when using candlestick patterns
Many traders misuse candlestick patterns in ways that reduce their effectiveness. Typical errors include
- Ignoring trend: Fading every engulfing pattern against a strong trend often leads to repeated small losses or being run over by momentum.
- Overfitting names: Trying to memorise dozens of exotic pattern names creates complexity without improving results. A few clean, well-understood patterns are enough.
- Trading mid-range signals: Taking hammer or shooting star patterns in the middle of a broad range, far from any obvious support or resistance, essentially turns the trade into a coin flip.
- Using no invalidation: Entering a pattern-based trade without a clear stop level turns a small idea into a potentially large problem.
- Forcing patterns on lower time frames: On very fast charts, candles can be distorted by spread, slippage or random ticks, making patterns less reliable.
The antidote is discipline: wait for clear structure, prioritise quality over quantity, and treat candlestick information as one layer in a multi-layer decision process.
Practical example of a pattern-based trade
Consider a forex pair in a clear daily uptrend. Price pulls back from recent highs and approaches an old resistance zone that previously capped price but has now been broken and retested once. This area is likely to act as support.
On the daily chart, you mark the zone. On the H1 chart, you watch how price behaves as it trades into that area. At first, you see a series of small bearish candles. Then, during a liquid session, a strong bullish engulfing candle forms exactly within the support zone, closing above the bodies of the prior few candles.
Here, the confluence is clear: dominant trend up, price reacting at a known level, and a candlestick pattern indicating a shift back towards buying pressure. You might choose to enter long at or shortly after the close of the engulfing candle, place a stop below the low of the pattern or below the support zone, and target a retest of recent highs or the next resistance above.
This example illustrates how candlestick patterns confirm a prepared idea rather than create it from scratch.
Conclusion: candlestick patterns as a language, not a signal generator
Candlestick patterns are best viewed as a language that describes market behaviour. Engulfing patterns show shifts in control, hammers and shooting stars highlight sharp rejection, and doji candles reveal hesitation. When these patterns occur at meaningful support and resistance levels, aligned with the prevailing trend and other technical evidence, they can help you time entries, define risk and exit with more confidence.
However, candlestick patterns alone do not guarantee profitable trades. They need the structure of a robust trading plan, complete with risk rules, clear objectives and realistic expectations. By treating candlestick patterns as one component in a broader process rather than a stand-alone signal generator, traders in forex, crypto and other markets can use them as a reliable lens on the ongoing battle between buyers and sellers.
Used this way, candlestick patterns become a consistent, repeatable tool for reading price action instead of a catalogue of names to memorise.