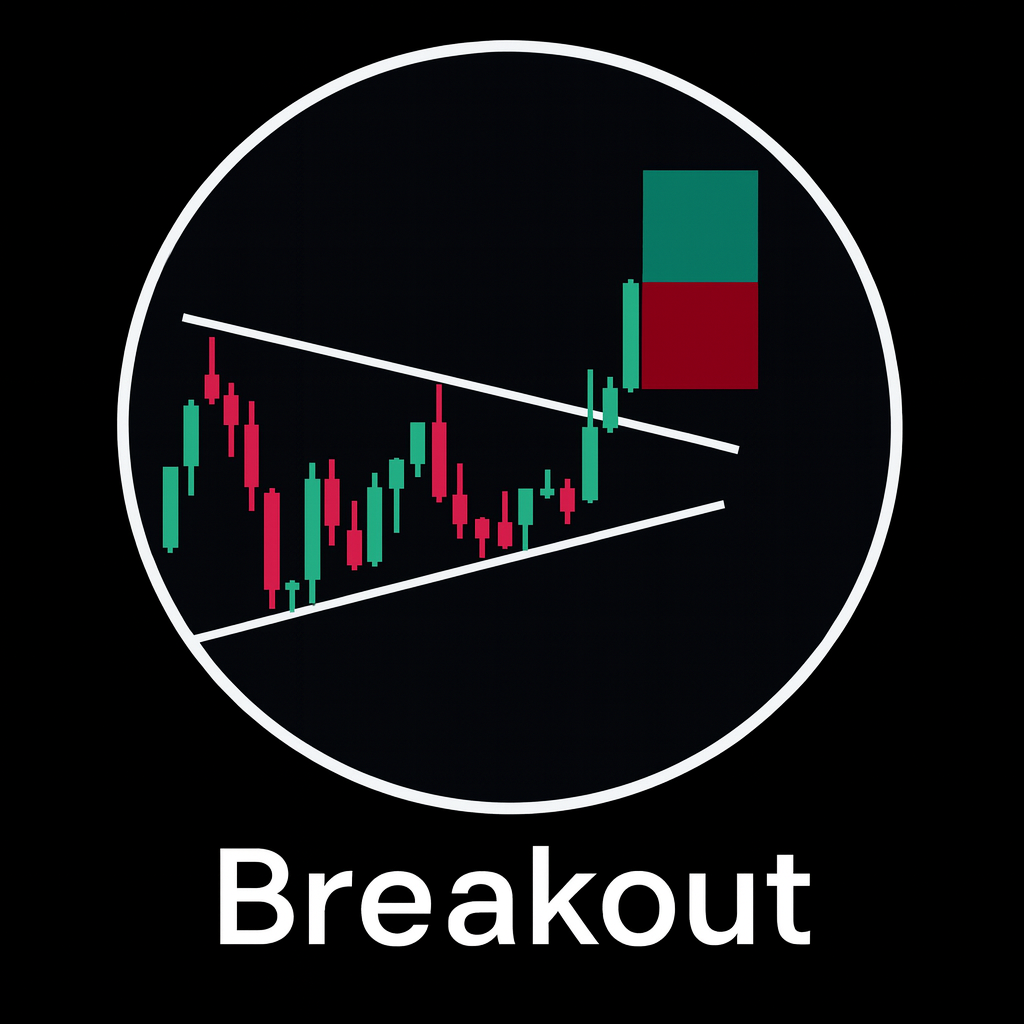
Breakout patterns sit at the heart of trend trading. Markets do not move in straight lines; they pause, compress, and then expand again. A breakout is the moment price escapes a well-defined consolidation zone and moves decisively in one direction. For active traders in forex, indices, stocks, or crypto, understanding breakout patterns is essential for catching clean moves with defined risk.
In simple terms, a breakout occurs when price trades for a period inside a clear structure – a range, wedge, triangle, or channel – and then prints a strong candle that closes beyond that structure. This transition from balance (consolidation) to imbalance (trend) is what makes breakouts attractive: volatility and opportunity often cluster around these moments.
What Are Breakout Patterns?
Breakout patterns are recurring price structures where the market builds energy in a confined area before releasing it. Inside the pattern, you typically see
- Well-respected boundaries (support and resistance) repeatedly tested.
- Gradually shrinking volatility – candles get smaller, wicks overlap.
- Reduced follow-through after each test of the range edges.
The breakout itself is usually marked by an expansion candle: a bar larger than recent candles, closing firmly outside the pattern with minimal wick against the breakout direction. This expansion is the signal that one side – buyers or sellers – has finally taken control.
High-quality breakout patterns provide three key ingredients for a trading plan
- A clearly defined line in the sand (the pattern boundary).
- An obvious invalidation level for risk (on the other side of the pattern).
- Room for price to travel into open space (low recent structure ahead).
Common Types of Breakout Patterns
Although there are many variations, most breakout setups fall into a few core categories.
Horizontal Ranges
A horizontal range is the simplest pattern. Price oscillates between support and resistance, often for many sessions. Candles move sideways, and neither buyers nor sellers maintain control. A breakout occurs when price closes beyond the top of the range (bullish) or below the bottom of the range (bearish).
Ranging behaviour often appears after a strong move when the market is digesting gains. Breakouts from such continuation ranges frequently align with the prior trend, but reversal breakouts from extended ranges can occur if higher-time-frame context supports a turn.
Triangles and Wedges
Triangles and wedges show compression more clearly. For example
- Ascending triangle: flat resistance, rising support.
- Descending triangle: flat support, falling resistance.
- Symmetrical triangle: falling highs and rising lows converging to a point.
- Wedges: both boundaries slope in the same direction, usually against the prior trend.
In these patterns, each swing is smaller than the last and volatility narrows. The market is literally being squeezed. Breakouts from triangles and wedges often produce sharp expansion because many traders place stop orders just outside the pattern boundaries.
Flags and Channels
Flags and channels are classic continuation breakout patterns. A strong impulsive leg is followed by a corrective channel that drifts against the main move. For example, after a strong bullish surge, price may form a downward-sloping channel – a bull flag. The breakout occurs when price punches out of the channel in the trend direction.
These patterns are valuable because they align with trend following. The breakout is not a random new move but a resumption of existing momentum after a controlled pullback.
Summary of Key Breakout Structures
| Pattern type | Main structure | Typical breakout direction | Notes |
|---|---|---|---|
| Horizontal range | Flat support and resistance | Either up or down | Watch for confluence with higher-time-frame trend. |
| Ascending triangle | Flat resistance, rising support | Often bullish | Shows buyers accepting higher lows before a push through resistance. |
| Descending triangle | Flat support, falling resistance | Often bearish | Shows sellers pressing lower highs into a fixed bid. |
| Symmetrical triangle | Lower highs and higher lows | Either direction | Focus on context: trend and key levels decide bias. |
| Flag / channel | Sloping correction against trend | With prior trend | Classic continuation breakout pattern after an impulse leg. |
How to Identify High-Quality Breakout Patterns
Not all consolidations deserve trades. The goal is to filter for higher-probability breakout patterns. Useful criteria include
1. Clear and Respected Boundaries
Price should respect the pattern lines multiple times. A range with only one touch at support and one at resistance is weak; a structure with three or more clean reactions on each side is stronger. Repeated rejection shows that other traders see the same lines and are acting on them.
2. Visible Compression
In good breakout patterns, volatility shrinks over time. Candles become smaller, highs and lows overlap, and failed moves are quickly brought back inside the structure. This compression suggests energy is being stored. When it releases, the move can be fast.
3. Expansion Candle
The breakout itself should be obvious. A quality breakout candle typically
- Is larger than recent bars.
- Closes decisively beyond the pattern boundary.
- Shows minimal wick against the direction of the break.
A weak close exactly on the line or with a long wick back inside the structure is more likely to be a fake move or liquidity grab.
4. Confluence and Context
Breakout patterns are much stronger when they align with other factors. Traders often demand confluence with
- Higher-time-frame trend direction (for example, H4 or D1).
- Key horizontal levels such as weekly highs, lows, or prior swing points.
- Volume or tick activity increases at the breakout moment.
- Time-of-day logic (London or New York session rather than quiet hours).
This context helps distinguish meaningful breakout patterns from random noise.
Trading Breakout Patterns: Entry and Exit Tactics
Once a valid breakout is identified, the next step is execution. Traders typically choose among three main entry approaches.
1. Aggressive Breakout Entry
The aggressive approach is to enter shortly before the breakout candle closes or immediately after a close beyond the boundary. This method offers the best chance of capturing the entire move but also exposes the trader to more false breakout risk.
Risk management here is critical: stops are usually placed just inside the pattern, on the opposite side of the breakout. Position sizing must respect the distance between entry and stop relative to account risk.
2. Conservative Retest Entry
Many traders prefer to wait for a retest of the broken level. After the breakout candle, price often pulls back to the former support or resistance. If that level now holds from the other side, it becomes a fresh entry point with tighter risk.
For example, after an upside breakout from a range, the top of the old range may be retested from above. If the retest holds and a smaller bullish candle forms, a long entry with a stop just below the level can provide a clean structure-driven trade.
3. Hybrid Scaling Approach
A hybrid method combines both styles: a small initial position on the breakout and additional size added on a successful retest. This divides risk over two locations and allows adaptation if the market breaks cleanly without offering a pullback.
Managing Risk and Targets on Breakout Trades
Risk management is what makes breakout patterns viable over the long term. Despite their appeal, breakouts fail frequently; the trader must be prepared for that outcome.
Typical guidelines include
- Stop placement: beyond the opposite boundary of the pattern or behind a key swing point inside the structure.
- Position sizing: define a fixed percentage of account risk per trade (for example, 0.5–1 percent) and size positions so that a full stop produces no more than that loss.
- First target: measured move based on the height of the pattern projected from the breakout point, or a nearby logical structure such as the next support or resistance.
- Trade management: partial profit at the first target, then move the stop to break-even or behind a fresh structure to let the remaining portion run.
In strong trends, breakout patterns can lead to multi-session moves. Trailing stops behind swing highs or lows, recent candles, or a chosen moving average can help capture more of the move while still protecting realised gains.
False Breakouts and How to Avoid the Traps
False breakouts are a fact of life. Price briefly trades beyond the pattern, triggers orders, then snaps back inside and often reverses. Professional traders accept this as part of the game and design plans to reduce their impact.
Practical filters to improve selectivity include
- Avoid breakout trades during low-liquidity times such as late sessions.
- Demand alignment with higher-time-frame trend for continuation breakouts.
- Focus on breakouts that occur at or from meaningful levels (session highs/lows, weekly levels, prior swing structure).
- Wait for the breakout candle to close rather than trading mid-candle spikes.
Even with these filters, some trades will fail. The key is to keep each loss small and to ensure that winning trades have enough potential reward to cover multiple losing attempts.
Practical Checklist for Breakout Patterns
Before committing capital to a breakout setup, walk through a simple checklist
- Is the pattern clear and visible to other traders, not just to you?
- Have the boundaries been tested multiple times and respected?
- Is there evidence of volatility compression before the break?
- Does the breakout candle show expansion and a strong close beyond the pattern?
- Does the setup align with higher-time-frame direction and key levels?
- Is your risk clearly defined, and is the potential reward at least twice the risk?
- Do you have a plan for both an immediate trend continuation and a retest scenario?
Using such a checklist helps treat breakout patterns as systematic trades instead of impulsive reactions to sudden moves.
Conclusion
Breakout patterns are one of the most efficient ways to participate in directional moves. They define a period of balance, show clear compression, and then release energy through a decisive breakout candle. When combined with higher-time-frame structure, key levels, and disciplined risk management, breakout patterns can form a robust core of any trend trading or intraday strategy.
The goal is not to predict every breakout perfectly but to build a repeatable process: identify strong consolidations, wait for quality breakouts, filter with confluence, and manage trades according to predefined rules. Used in this way, breakout patterns move from being exciting chart events to becoming a structured and professional trading tool.