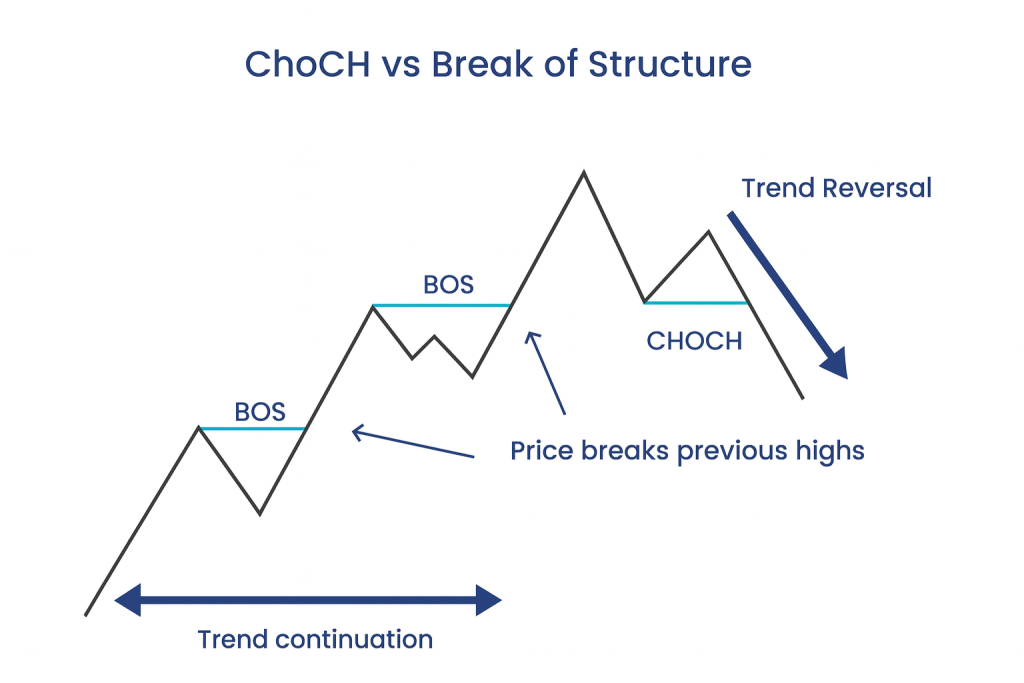
Break of Structure (BOS) sounds like some mysterious new discovery, but it is simply a modern label for something traders have watched for more than a century: price breaking past previous swing highs and lows. Long before anyone wrote BOS on a chart, traders were already reading higher highs and higher lows in uptrends, lower lows and lower highs in downtrends, and treating breaks of those levels as confirmation that the trend was still alive.
In other words, Break of Structure (BOS) does not belong to any private group, secret classroom or closed community. It is not a new invention. It is just a clear way to describe what every serious technician already sees when price pushes into new territory and extends the existing trend.
What BOS Really Means: Classic Market Structure
At the core, BOS is basic market structure written with new terminology. Market structure describes the sequence of swing highs and swing lows over time
- In an uptrend, price prints a sequence of higher highs (HH) and higher lows (HL).
- In a downtrend, price prints a sequence of lower lows (LL) and lower highs (LH).
Now add a simple rule: when price closes beyond the last key swing in the direction of the trend, the structure has extended.
- In a bullish sequence HH – HL – HH – HL, a new candle closing above the last HH is a bullish BOS.
- In a bearish sequence LL – LH – LL – LH, a new candle closing below the last LL is a bearish BOS.
This is not magic. It is a practical way of saying: the side that was in control just proved it again. Buyers proved strength by forcing price above prior resistance; sellers proved strength by forcing price below prior support.
Why BOS Is Not a New Invention or a Private Secret
Many traders first hear the phrase Break of Structure (BOS) presented as if it were a revolutionary idea tied to a particular mentor, course or community. That marketing story collapses the moment you compare it with older technical analysis.
Dow Theory, classical trend analysis and old-school chart reading have always cared about
- Price making new swing highs or lows.
- Previous swing points acting as confirmation levels.
- Trends remaining valid until structure is broken in the opposite direction.
BOS is simply a compressed label for that logic. Every trader who draws support and resistance, who watches weekly highs and lows, who tracks breakouts and pullbacks, is already paying attention to breaks of structure, even if they never write the letters B, O, S on a chart.
The important takeaway is this: BOS is part of the common toolbox of technical analysis, not intellectual property of any group. The concept is free, the price data is public, and the logic is available to anyone willing to observe charts carefully.
BOS vs Change of Character (CHoCH)
Once you understand BOS, it is easy to see how it pairs with the idea often called Change of Character (CHoCH)
- BOS describes continuation. The current trend proves it is still in control by breaking the last structural barrier in its direction.
- CHoCH describes potential reversal. The market breaks a key swing against the prior trend, suggesting that control might be shifting.
For example, in a strong uptrend you get a series of bullish BOS events as price steps higher. The first time price manages to break below a meaningful prior higher low, you no longer have pure bullish structure; something has changed in character. That break could be the seed of a major reversal, or the start of a larger range.
Thinking in terms of BOS and CHoCH simply gives you a precise vocabulary for what your eyes already see: continuation versus potential transition.
How Traders Use BOS in Practice
Most practical strategies do not trade the BOS candle itself. Instead, traders use BOS as a structural signal and then plan trades around the pullbacks that follow. Typical workflows include
1. Confirm the Trend Bias
First, decide who is in control on the higher time frame
- On the daily or four-hour chart, identify whether swings are forming HH–HL or LL–LH.
- Mark the last significant swing high in an uptrend or swing low in a downtrend.
- Wait for price to break that level and close beyond it. That is your BOS.
Once a bullish BOS appears on the higher time frame, many traders commit to only looking for long setups until the structure clearly changes. The opposite applies after a confirmed bearish BOS: they focus on short opportunities.
2. Trade the Pullback, Not the Break
The BOS candle itself is usually impulsive and stretched. Entering on that candle often means chasing and accepting a poor reward-to-risk ratio. A more professional approach is
- Let the BOS candle close and mark the broken level.
- Identify nearby technical features that could act as a reaction zone: demand or supply, fair value gaps, prior consolidation shelves, or moving averages.
- Wait for price to retrace back into that zone, then watch for lower time frame confirmation such as rejection wicks, engulfing candles, or a micro CHoCH in the direction of the main trend.
In this way, BOS defines the framework and bias; the entry comes from the pullback and the local price action.
3. Use BOS to Place Logical Stops and Targets
Because BOS is defined by swings, it naturally suggests where risk and reward should be placed
- In a bullish context, stops can be placed below the higher low that led to the BOS, or below the demand zone you are using for entry.
- Targets can be placed at the next projected swing high, the next liquidity pool, or key higher time frame levels.
This keeps the trading plan logically tied to structure rather than arbitrary pip counts.
Integrating BOS with Darren-Style Methodology
Within a Darren-style approach that combines multi-time-frame structure, key levels, and precise intra-day execution, BOS plays a clear role as the backbone of trend definition. The method does not worship BOS as a standalone signal; instead, it embeds it into a broader context
1. Multi-Time-Frame Structure
The process typically starts from the top down
- On weekly and daily charts, mark major swing highs and lows and identify where BOS has recently occurred.
- On four-hour and one-hour charts, refine structure: where did the last clear BOS happen, and in which direction?
- Use that information to define whether you will be a buyer or seller on the execution time frame, often the one-minute chart.
If the daily and four-hour charts show a fresh bullish BOS, a Darren-style trader will strongly prefer long setups on the one-minute chart, especially around demand zones and after intraday liquidity sweeps.
2. BOS, Liquidity Sweeps and 2B Reversals
Another key idea in that methodology is the relationship between BOS and failed breaks. A failed attempt to create BOS in one direction can set up a strong move in the opposite direction.
- Price pushes above a prior high, tempting traders to read it as bullish BOS.
- Instead of holding above, price snaps back below the level and forms a reversal pattern, often resembling a 2B reversal.
- This failure tells you that the attempted BOS was more of a liquidity grab than genuine continuation.
In practice, the method uses successful BOS on the higher time frame to define the big picture bias, and failed BOS attempts on lower time frames as triggers for sharp counter-moves or entries back into the main trend after liquidity is cleared.
3. BOS with Dynamic Tools and Intraday Structure
Within such a system, BOS is rarely seen alone. It is used alongside tools like moving averages and volatility measures
- Trend filters such as medium and long moving averages help confirm whether a BOS aligns with the underlying direction or is occurring into a higher time frame barrier.
- Average Daily Range (ADR) readings warn you when a BOS occurs at the extreme of the day, where continuation potential may be limited and mean reversion forces grow stronger.
- Oscillators or momentum tools can signal when a BOS is supported by strong momentum versus when it looks tired and stretched.
The result is not a mechanical BOS system, but a structured decision process: higher time frame BOS defines bias, intraday BOS and failed BOS define timing, and the supporting tools manage risk and expectations.
Common Mistakes When Trading BOS
Because the phrase sounds impressive, traders often misuse Break of Structure (BOS). Some of the most common mistakes include
1. Seeing BOS Everywhere
Not every tiny swing on a one-minute chart is a valid structural pivot. If you label every fluctuation as BOS, the concept loses meaning. Structure must be defined consistently
- Decide how many candles or how much distance qualifies as a swing.
- Respect the higher time frame first; do not let a minor one-minute blip overwrite a clean four-hour trend.
- Focus on clear, obvious swing points that most traders would agree on.
2. Ignoring Context and Higher Time Frames
A bullish BOS on the five-minute chart that slams straight into massive weekly resistance is not the same as a bullish BOS in the middle of a wide-open, trending environment. Without context, BOS is just a broken level; with context, it becomes a continuation signal or a trap.
3. Chasing BOS Candles
Jumping into the market right as the BOS candle closes is emotionally tempting. It feels like you are catching momentum. In reality, you are often accepting
- Large stop distances, because the nearest logical low or high is far away.
- Poor reward-to-risk, because a good portion of the move has already happened.
- Vulnerability to immediate pullbacks that shake out late entries.
The disciplined approach is to let BOS inform you where the advantage lies, then calmly wait for price to come back to you.
4. Treating BOS as a Trademarked Secret
One of the more subtle errors is psychological: believing that using the term BOS instead of simply saying “break of the previous high or low” somehow grants access to superior edges. The edge never comes from the label; it comes from consistent application, risk management and emotional control.
Calling something Break of Structure (BOS) does not make it special. The market does not care what name you use. It only responds to order flow, liquidity and the behaviour of participants around those key levels.
Building a Simple BOS-Based Playbook
To move from theory to practice, you can formalise a straightforward BOS playbook
- Select a higher time frame (for example, H4) to define the main trend.
- Identify the last major swing high and swing low and mark them clearly.
- Wait for a clean BOS in one direction: a decisive close beyond that swing.
- Once BOS appears, align your bias with that direction until a clear CHoCH invalidates it.
- Drop to a lower time frame to find pullbacks into support or resistance, fair value gaps, or demand and supply zones that align with the BOS direction.
- Use price action, such as rejection wicks or small CHoCH in the direction of the main trend, to refine entry.
- Place stops beyond the structural point that defines your setup and manage the trade towards logical targets.
This workflow keeps the role of BOS clean and realistic: it is the structural trigger that tells you which side deserves your attention, not a magic pattern that guarantees wins.
Conclusion: BOS as a Clear, Honest Name for an Old Idea
Break of Structure (BOS) is simply a modern name for an old idea: the trend is proven when price breaks beyond previous swings in the direction of that trend. Every chartist who has ever respected higher highs and higher lows, or lower lows and lower highs, has been working with BOS long before the label existed.
BOS does not belong to a group, a method or a secret circle. It belongs to the shared language of technical analysis. Used correctly, it helps you
- Define trend direction objectively.
- Stay aligned with the dominant side.
- Organise entries, stops and targets around clear structural points.
- Integrate seamlessly with methods that use multi-time-frame analysis, liquidity concepts and precise intraday execution.
The real edge is not in owning a special term. It is in patiently applying that term to real charts, in real time, with real discipline. Treat Break of Structure (BOS) as a clean, honest description of what price is doing, plug it into a robust risk framework, and it becomes one more reliable piece of a complete trading process.