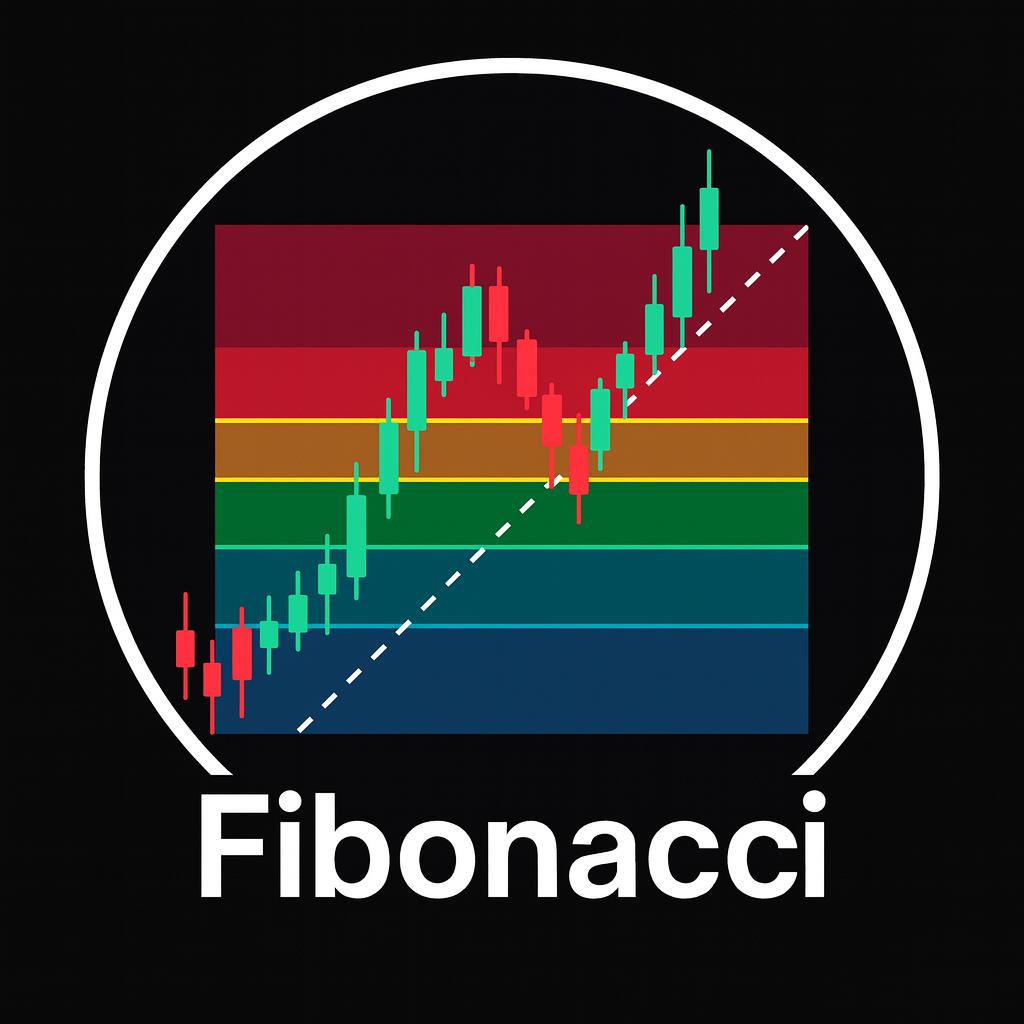
Fibonacci retracements are one of the most widely used tools in technical analysis, especially among forex traders who rely on trend following and precise pullback entries. The basic idea is simple: when price makes a strong move in one direction, it rarely moves in a straight line. Instead, it tends to pull back in stages before continuing the trend. Fibonacci retracement levels provide a structured way to measure and trade those pullbacks.
In their most common form, Fibonacci retracements are drawn from a completed swing low to swing high in an uptrend, or from swing high to swing low in a downtrend. The tool automatically plots horizontal lines at key ratios of that move, such as 23.6%, 38.2%, 50%, 61.8% and 78.6%. These levels act as potential support or resistance zones where price may pause, react, or fully reverse.
How Fibonacci Retracements Are Constructed
The Fibonacci sequence is a series of numbers where each number is the sum of the previous two: 0, 1, 1, 2, 3, 5, 8, 13 and so on. Ratios derived from this sequence appear throughout nature and are often used in market analysis. In trading, we work mainly with ratios such as 0.236, 0.382, 0.5, 0.618 and 0.786.
When you apply the Fibonacci retracement tool to a chart, you
- Identify a clear impulse move. In an uptrend, this means a visible swing from a significant low to a clear high. In a downtrend, the reverse.
- Anchor the tool from low to high in an uptrend (or high to low in a downtrend).
- Allow the platform to calculate the intermediate levels as percentages of that entire price move.
Each level represents the proportion of the prior move that price has given back. A retracement to the 38.2% level means price has pulled back 38.2% of the original impulse; a 61.8% retracement means almost two thirds of the move has been retraced.
The Key Fibonacci Retracement Levels
In practice, not all levels are treated equally. Many traders focus on the 38.2%, 50% and 61.8% retracement levels, often referred to collectively as the golden pocket. Pullbacks that remain inside this pocket tend to offer the best combination of trend continuation probability and favorable reward-to-risk.
| Level | Typical Price Behavior | Practical Notes |
|---|---|---|
| 23.6% | Very shallow pullback | Often seen in strong runaway trends; entries can be aggressive here. |
| 38.2% | Healthy, shallow correction | Common in strong trends; continuation entries with tight stops. |
| 50% | Midpoint of the move | Not a pure Fibonacci ratio but widely used as a psychological halfway mark. |
| 61.8% | Deep but still trend-consistent pullback | Classic golden ratio; often used for swing entries with larger targets. |
| 78.6% | Very deep correction | High risk of full reversal; needs strong confluence for safe entries. |
Using Fibonacci Retracements in an Uptrend
In an uptrend, Fibonacci retracements help you avoid chasing price at the high and instead wait for a controlled pullback. After a strong bullish impulse, you draw the tool from the swing low to the swing high. As price retraces downward, you watch how it behaves around each level.
A shallow pullback to around the 38.2% level that quickly prints strong bullish candles can signal that buyers remain in control and the trend is likely to continue. This kind of move often suits intraday traders and scalpers who prefer tighter stops and quicker trades.
Deeper pullbacks into the 50% or 61.8% areas can offer better reward-to-risk, because your stop can be placed just beyond the swing low while your target aims for a retest or extension of the prior high. However, the deeper the pullback, the more important it becomes to check higher-time-frame structure. If the higher time frame still supports an uptrend, a 50–61.8% retracement can be a high-quality continuation opportunity.
Using Fibonacci Retracements in a Downtrend
In a downtrend, the logic is reversed. You draw the Fibonacci tool from the swing high down to the swing low, and watch for price to retrace back upward into the levels. The retracement becomes a potential shorting zone if bearish structure remains intact.
For example, after a strong bearish leg, a retracement into the 38.2% zone followed by clear rejection candles (long wicks to the upside, strong bearish bodies) suggests sellers are defending the area. A deeper rally into 50% or 61.8% offers better risk-to-reward for swing shorts, as long as the broader trend and market context still favor downside.
Confluence: Where Fibonacci Retracements Become Powerful
Used alone, Fibonacci retracements can turn into arbitrary lines on the chart. What makes them valuable is confluence: the alignment of multiple independent factors around the same price region. When a retracement level overlaps with other technical elements, the area becomes more significant.
Common confluence factors include
- Previous horizontal support or resistance levels.
- Trend lines drawn from prior swing highs or lows.
- Commonly watched moving averages, such as the 50 or 200 period MA.
- Order blocks or consolidation zones where price previously accumulated.
- Round numbers or psychologically important levels.
For example, a 61.8% retracement that coincides with a prior resistance turned support level and a rising 50 period moving average is far more interesting than a bare 61.8% level in the middle of nowhere. In that scenario, multiple groups of traders are likely to be watching the same zone, increasing the potential for a strong reaction.
Structuring a Trade Plan Around Fibonacci Retracements
Fibonacci retracements in forex trading are most effective when integrated into a complete trade plan rather than used as standalone signals. A structured approach usually includes
1. Market Context
Before drawing any Fibonacci levels, confirm the market environment. Is the pair in a clear trend or a choppy range? On higher time frames, are you at major support, resistance, or in the middle of a broader structure? Fibonacci tools work best when they are used inside a well-defined trend or after a clean impulse move.
2. Entry Logic
After a strong impulse, wait for price to retrace into your chosen Fibonacci zone, typically within the 38.2% to 61.8% golden pocket. Look for confirmation such as
- Rejection wicks at the level.
- Bullish or bearish engulfing candles in the direction of the trend.
- A return of momentum confirmed by indicators or volume behavior, if you use them.
3. Stop Loss Placement
Stops are often placed beyond the swing point that defined the Fibonacci measurement. In an uptrend, if you measure from a swing low to high, a common approach is to place the stop just below the swing low or slightly beyond the 78.6% retracement. This protects you from normal noise but exits the trade if the trend truly fails.
4. Take Profit Targets
Initial targets usually aim for a retest of the prior high or low that defined the swing. More ambitious targets can project Fibonacci extensions, such as 127.2% or 161.8% of the original move. This allows you to build a position near the retracement and then hold a portion of the trade for a larger trend continuation.
Common Mistakes When Using Fibonacci Retracements
Many traders misuse Fibonacci retracements in ways that reduce their effectiveness. Common errors include
- Forcing the tool onto messy, overlapping price action without a clear impulse swing.
- Ignoring higher-time-frame structure and trading every retracement as if the trend will continue forever.
- Treating a single level as guaranteed support or resistance instead of a zone that needs confirmation.
- Stacking multiple Fibonacci grids from different swings and cluttering the chart until nothing is clear.
To avoid these issues, be selective. Choose the most obvious, recent swing that stands out on your chart. Use a small number of clean levels rather than covering your screen with lines. Combine Fibonacci with price action and structure, not as a substitute for them.
Integrating Fibonacci Retracements Into a Forex Trading Strategy
Fibonacci retracements fit naturally into strategies that revolve around trend continuation, pullbacks, and confluence. For intraday forex traders, they can help time entries after the London open when the first impulse of the day often retraces before continuing. For swing traders, they can define entries after news-driven spikes or strong weekly moves.
In all cases, Fibonacci retracements should be part of a rules-based framework. Define which time frames you use to draw your swings, which levels you treat as actionable, what confirms your entries, and how you manage risk. When combined with discipline and a consistent process, they offer a logical way to turn chaotic charts into structured trade plans.
Conclusion
Fibonacci retracements in forex trading are not magic. They do not predict the future and they are not guaranteed turning points. What they do provide is a structured way to measure pullbacks, identify high-probability zones, and build trades around objective levels instead of emotion. When aligned with trend direction, price action, and other forms of confluence, Fibonacci retracement levels can become a powerful component of a professional trading strategy.