
Summary:
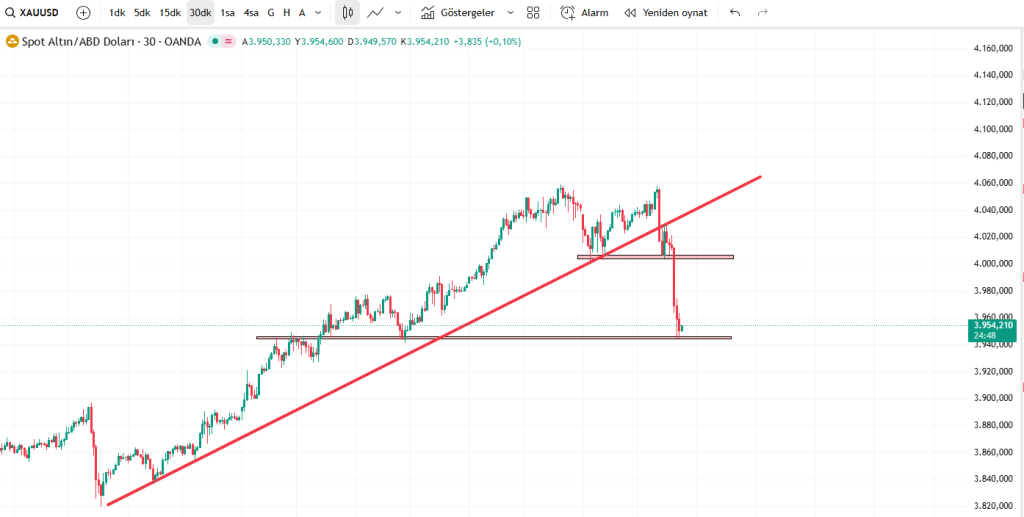
Gold (XAU/USD) has broken its long-term ascending trendline, triggering a sharp decline toward the 3,950 support zone. This breakdown signals a potential shift in market momentum as sellers gain control. Price is now testing a key demand area, which could produce a short-term bullish reaction or confirm further downside continuation.
XAU/USD Technical Analysis — Trendline Breakdown and Support Reaction
The recent movement in the XAU/USD chart reflects a critical technical shift. After weeks of maintaining a strong uptrend, gold prices have finally broken below the red ascending trendline. This trendline had served as a dynamic support level, guiding the bullish momentum. The break signals a transition from accumulation to distribution — a phase where buyers lose strength and sellers begin to dominate.
Trendline Breakdown: A Shift in Market Structure
The sharp breach below the red trendline was confirmed by consecutive strong bearish candles. Such impulsive selling often indicates institutional activity or a fundamental catalyst, such as an increase in U.S. Treasury yields or a strengthening U.S. dollar. The psychological level around 4,000 failed to hold as support, opening the door to deeper retracement.
In technical terms, this event transforms the former trendline and broken horizontal zones into potential resistance areas. Traders should now monitor whether price retests this region before continuing its decline. The principle of “support becomes resistance” (SBR) is likely to apply here.
Key Support Levels and Price Behavior
The next major horizontal support is found near 3,950. This area has previously acted as a reaction zone where buyers absorbed selling pressure. On the current 30-minute and 5-minute charts, the price shows a clear spike down to this level followed by candles with long lower wicks — an early sign of buying interest. These wicks indicate that while sellers pushed prices lower, buyers stepped in aggressively near support.
If gold holds above 3,950 and consolidates with higher lows, we could see a short-term rebound toward 3,990–4,010. Conversely, a close below 3,945 would invalidate this potential and likely trigger further selling toward 3,920 or even 3,900.
Potential Scenarios
- Bullish Rebound Scenario: Price stabilizes around 3,950, forming a double bottom or bullish engulfing pattern. Buyers could then target the 4,000 resistance zone.
- Bearish Continuation Scenario: If the 3,945 level fails, the market may enter a new bearish leg with 3,920 as the next support. Sellers would dominate until a clear reversal structure appears.
Market Psychology and Volume Dynamics
The impulsive drop that followed the trendline break is a textbook example of stop-loss hunting. Many traders who bought along the trendline were forced to close positions as price sliced through their stops. This cascade of selling often exaggerates the initial move but eventually leads to an oversold reaction. Understanding this dynamic helps traders avoid emotional entries during panic-driven moves.
Volume behavior also supports this interpretation. The volume tends to spike during breakdowns and gradually decline as the market finds temporary equilibrium. The stabilization phase is often where smart money starts accumulating again.
Conclusion
Technically, gold has shifted from a strong uptrend into a correction phase. The 3,950 zone will determine whether this is a temporary pullback or the start of a broader bearish cycle. Traders should watch for confirmation signals before committing to new positions. If price bounces decisively from this support, a retest of 4,000–4,010 is likely. If it breaks below 3,945 with volume, the bearish continuation may accelerate.
For educational purposes, this analysis aims to illustrate how price action structure and trendline dynamics interact. Always confirm technical patterns with broader context — including macroeconomic data and risk sentiment — before trading decisions.
Disclaimer: This analysis is for educational purposes only and does not constitute financial advice.
For more detailed trading insights, visit dominionfx.net or check reliable external sources such as Investing.com.
