The candle pattern is a price action concept that marks potential reversal zones in the market. The shared chart examples and discussions highlight how levels are determined, how they function as buyer/seller zones, and under what conditions they remain valid or become invalid.
Question
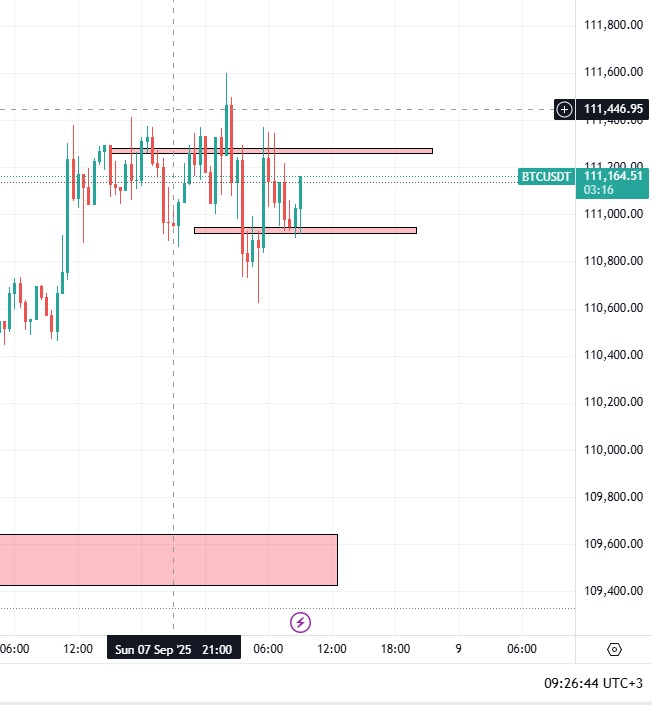
In the 30-minute BTC/USDT chart, is the 3CR level represented by the green line or the red line?
Short Answer
The correct level is not determined by the color of the line, but by whether the engulfing candle within the last three candles completely covers the prior body and wick and confirms with a closing price.
Detailed Explanation
What is the 3CR?
The 3 Candle Reversal occurs when, within the last three candles, the market produces a strong opposite candle that completely engulfs the body and wick of the prior move.
- In a downtrend, a strong bullish candle that swallows the lows and closes upward may indicate a reversal zone.
- In an uptrend, a strong bearish candle that covers the highs and closes downward defines the reversal zone.
This is not about memorizing candle shapes—it’s about understanding the market psychology: buyers or sellers have shown enough strength in the last three candles to shift momentum.
The 3 Candle Reversal can also be seen as an advanced variation of the classic engulfing candle strategy [Investopedia – Engulfing Pattern].
Zone Logic
Once a 3CR forms, the area defined by the engulfing candle becomes a potential demand or supply zone.
- As long as price action respects this area and candles remain inside it, the zone is considered valid.
- If a decisive close occurs outside the zone, the 3CR becomes invalid.
This is why traders don’t just mark the line arbitrarily—they look for the candle that truly engulfs and closes with confirmation.
To strengthen the reliability of 3CR setups, traders often combine it with other tools such as moving averages and RSI. We covered this approach in detail here: The Power of Confluence in Forex.
Insights from the Conversation
In the shared WhatsApp messages, the trader asked: “On the 30-minute BTC/USDT chart, is the 3CR level the green line or the red line?”
The explanation was:
- The important point is not the color of the line, but whether the last three candles satisfy the engulfing condition.
- The valid 3CR level is the one where the candle fully engulfs the prior wick and body and confirms with a closing price.
Image Explanations (based on screenshots)
- First chart (BTC/USDT): Supply and demand zones are marked with rectangular boxes, representing potential 3CR areas.
- WhatsApp text: Explains that the logic is “the reversal within the last three candles.”
- Another screenshot: 30-minute BTC/USDT chart with RSI at 57.90. The trader is asking whether the green or red line represents the correct 3CR.
Key Notes
- 3CR is valid only when the body and wick are engulfed.
- The zone acts as a buyer/seller level until broken.
- Invalidity occurs when price closes decisively outside the zone.
- Multi-timeframe (MTF) context improves reliability.
Example / Scenario
- Setup: In a downtrend, a strong bullish candle engulfs the last three candles’ bodies and wicks.
- Signs: The prior low and wick are completely covered.
- Trigger: This marks a demand zone (buy area).
- Invalidation: If price later closes below the engulfing candle’s low, the 3CR is invalid.
Glossary
- 3CR (3CR pattern): A reversal formed when the last three candles show engulfing price action.
- Supply Zone: An area where sellers dominate, pushing price lower.
- Demand Zone: An area where buyers dominate, pushing price higher.
References
- Darren – 2B/3CR methodology (transcripts)
- Al Brooks – Price Action Trading books
⚠️ Disclaimer: This content is for educational purposes only and does not constitute financial advice.