12.09.2025 XAUUSD M1 — Analysis
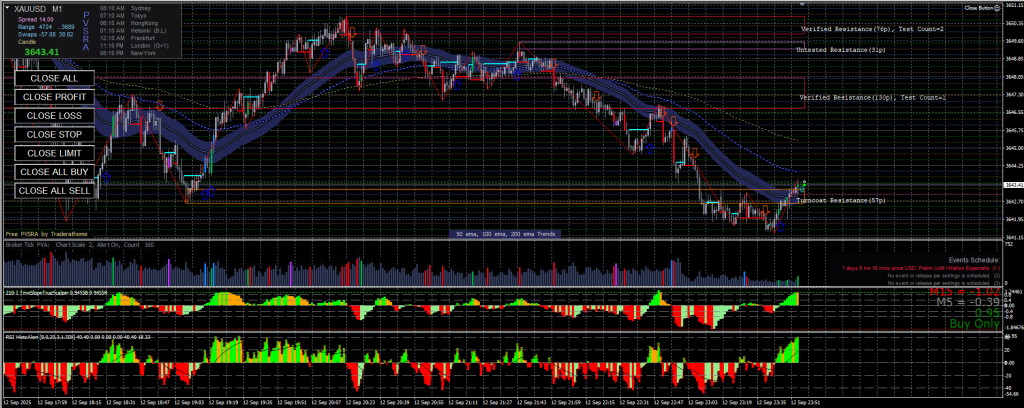
• Higher-time context (from the visible M1 move + EMA/TMA slope): the dominant short-term regime is bearish. EMAs are fanned down, the TMA bands slope down, and price has been making lower highs and lower lows across the right‑hand side of the chart. The current move is a short-term bounce off a fresh low (around 3641.15) into the lower/mid TMA band — so this is a counter‑trend bounce inside a clear M1 downtrend unless structure changes.
• Volatility/spread note visible on chart: spread shows 14 (wide for M1 scalping); exercise caution around thin liquidity.
1) Market state (trend strength, volatility, structure)
• Trend strength: medium–strong down. Downward EMAs + sloping TMA indicate continuation bias for sellers.
• Volatility: a visible climactic volume spike at the last low followed by an impulse bounce — typical of an exhaustion/absorption reaction, not necessarily a full trend flip.
• Structure: overall LH / LL. The most recent leg created a new low ~3641.15; the subsequent rally has not yet produced a higher high vs the previous swing high — so no HL→HH structural shift yet. Treat any longs as counter‑trend until proven otherwise.
2) Key levels (from the chart labels)
• Immediate support: recent swing low 3641.15 (hard invalidation for any bullish 2B).
• Immediate resistance / turncoat: Turncoat Resistance (57p) ~3642.7–3643.0 (label on chart just under current price).
• Next resistance: Verified Resistance ~3647.3 (labeled).
• Higher resistance: Verified Resistance above ~3650+ (labels visible on chart).
Use the recent low (3641.15) and the turncoat ~3642.7 as the short-term decision corridor.
3) Momentum: RSI / RSI-histo observations and divergences
• At the last low (~3641.15) the RSI-histogram flipped from deep red to green and showed a higher low relative to the prior swing (price made a marginal or equal low while the RSI-histo made a cleaner higher low) — that is a positive (bullish) divergence signal on M1. This divergence preceded the bounce.
• Important Darren rule: divergence = heads-up, not an immediate trade unless structure confirms. Here the histogram crossed the zero line with persistence of green bars (several consecutive green bars), giving short-lived momentum to the bounce — but we need 3+ bars of persistence plus price structure change (HL/HH) on higher TFs to treat as trend flip.
• On the rejection side: watch for RSI-histo color flip back to red and a zero-line failure on follow-through; that would favor continuation down.
4) TMA bands / EMAs
• TMA bands are sloping down; price recently hit the lower TMA band and bounced into the lower/mid band.
• EMAs (50/100/200) are aligned/fanned down and still above price for the majority of the move. That configuration is a “sell rallies” baseline per the Darren rules.
• Behavior: bounce reached the lower band with momentum expansion (volume spike) and is now testing the band mid/upper edge and the turncoat area. With the TMA downward slope, band edges are continuation zones — we respect that the bands bias continuation unless we get a multi‑bar rejection (3CR) or EMAs curl.
5) PVSRA / Volume context
• A large volume bar occurred into the last low — suggests either climax selling and absorption or a liquidity sweep. The bounce that followed shows moderate buying volume but not a clear, sustained absorption signature that changes the overall HTF bias.
• Practical takeaway: last low could be a short-term exhaustion bottom producing a bounce (2B/3CR candidate), but on failure to build volume into the bounce and form HH price will likely re-test and break lower.
6) Scenarios + trigger logic (explicit 2B / 3CR / BPBC)
A. Counter‑trend LONG (2B or 3CR) — lower probability, defined entry:
• Condition (2B): If price marginally sweeps the prior low (~3641.15) then quickly reclaims and closes back inside the prior range, treat as a 2B. Entry = reclaim & first shallow pullback above the reclaimed low. Confirmation = RSI‑histo stays green and does not fail the zero-line (3+ green bars) + price holds above the turncoat (~3642.7).
• 3CR long variant: Impulsive probe into lower band → indecision/stall candle → bullish rejection/engulfing candle on follow‑through. Entry = on the rotation candle close + momentum continuation (volume pick up). Target ladder = mid‑TMA / 50EMA (~first target) then 3647 (verified resistance). Invalidation = close back below the sweep low 3641.15 (hard invalidation).
B. Trend‑continuation SHORT (higher-probability given context) — BPBC/3CR sell setups:
• BPBC short: If price fails to hold above the turncoat resistance / lower TMA midline and subsequently sells off below the pullback low, setup is: break of the short-term swing high (no, reversed: break of swing low then pullback into broken support) — practically, wait for a shallow pullback into the lower TMA/50EMA/turncoat zone and a bearish rejection (bearish engulf / wick rejection) with red RSI‑histo and expanding selling volume. Entry = the rejection candle close or on the first impulsive red candle after the pullback. Target ladder = retest of recent low (3641.15) then new lower support (next floor). Invalidation = sustained reclaim and close above 50EMA + HH formation.
• 3CR short at band edge: an impulsive leg up into the mid/upper TMA, small indecision bar, followed by a strong bearish candle with volume expansion — entry on the bearish follow‑through. Again confirmation = RSI‑histo flips red and loses zero-line; volume expands for sellers.
7) What must change for a counter‑trend flip
• For us to flip bias bullish (trade longs as trend trades), M1 needs to produce HH above the recent swing high (and more importantly M15/H1 need to show HL→HH and EMA curl). EMAs must begin curling up (50 crossing toward 100, price consistently above 50/100), TMA slopes flatten then turn up, and RSI‑histo must maintain positive persistence. Until then, any long is a counter‑trend scalp.
8) Risk, caveats, scheduled events
• Chart shows no immediate major economic release in the next hour (events widget = none), but liquidity on M1 is thin and spread is wide (14). Expect sweeps and fake moves around thin liquidity.
• Use small size or wait for clean confirmation — Darren’s retest rule: our trade is the retest, don’t chase first impulse.
Summary / Narrative (compact)
• Market is biased down: EMAs fanned down, TMA sloping down and price below the band center. The last low (~3641.15) generated a bullish divergence on the RSI‑histo and a volume spike which produced a counter‑trend bounce into the lower/mid TMA and the turncoat resistance ~3642.7. That bounce is insufficient to declare a trend flip: we need HH + EMA curl and persistence on RSI-histo across higher TFs. Tactical trades: sellers remain preferred — wait for a clean bearish rejection at the turncoat/EMA/TMA midline (3CR) or for a shallow pullback into the broken level to fade (BPBC). If you want to play the long 2B, require a clear reclaim of the swept low, RSI-histo persistence (3+ bars) and tight invalidation below 3641.15.
TL;DR (5 bullets)
• Bias: Short bias (sell rallies) — EMAs fanned down, TMA slope down; current rally is counter‑trend until HL→HH + EMA curl.
• Trigger (short): Bearish rejection (3CR) at turncoat/EMA/TMA midline or BPBC short after shallow pullback into that zone with red RSI‑histo + expanding selling volume.
• Trigger (long): 2B (sweep & reclaim) or 3CR at lower band — only enter long if reclaim of swept low holds and RSI‑histo shows 3+ green bars / zero-line persistence.
• Key levels: Support = recent low 3641.15 (hard invalidation for longs); Turncoat resistance ≈ 3642.7–3643.0 (first decision); Next resistance ≈ 3647.3 (verified resistance).
• Invalidation: For shorts — sustained clear close above 50/100 EMA with HH formation (and EMA curl). For longs — close back below 3641.15 (sweep fails).
If you want, I can mark exact entry/stop/target price ranges on the chart (M1 scalp size) following either a 3CR short or a 2B long setup.